
Chúc mừng bạn đã hoàn thành khóa học xuất sắc 🎉
Nâng tầm phân tích – Kết nối dữ liệu – Dẫn đầu quyết định
Khóa học "Master Analytical Thinking & Data Analysis with Power BI" tại MazHocData mang đến tư duy phân tích và kỹ năng Power BI thực chiến, sẵn sàng ứng dụng vào doanh nghiệp thực tế.
HR Performance Monitoring Dashboard
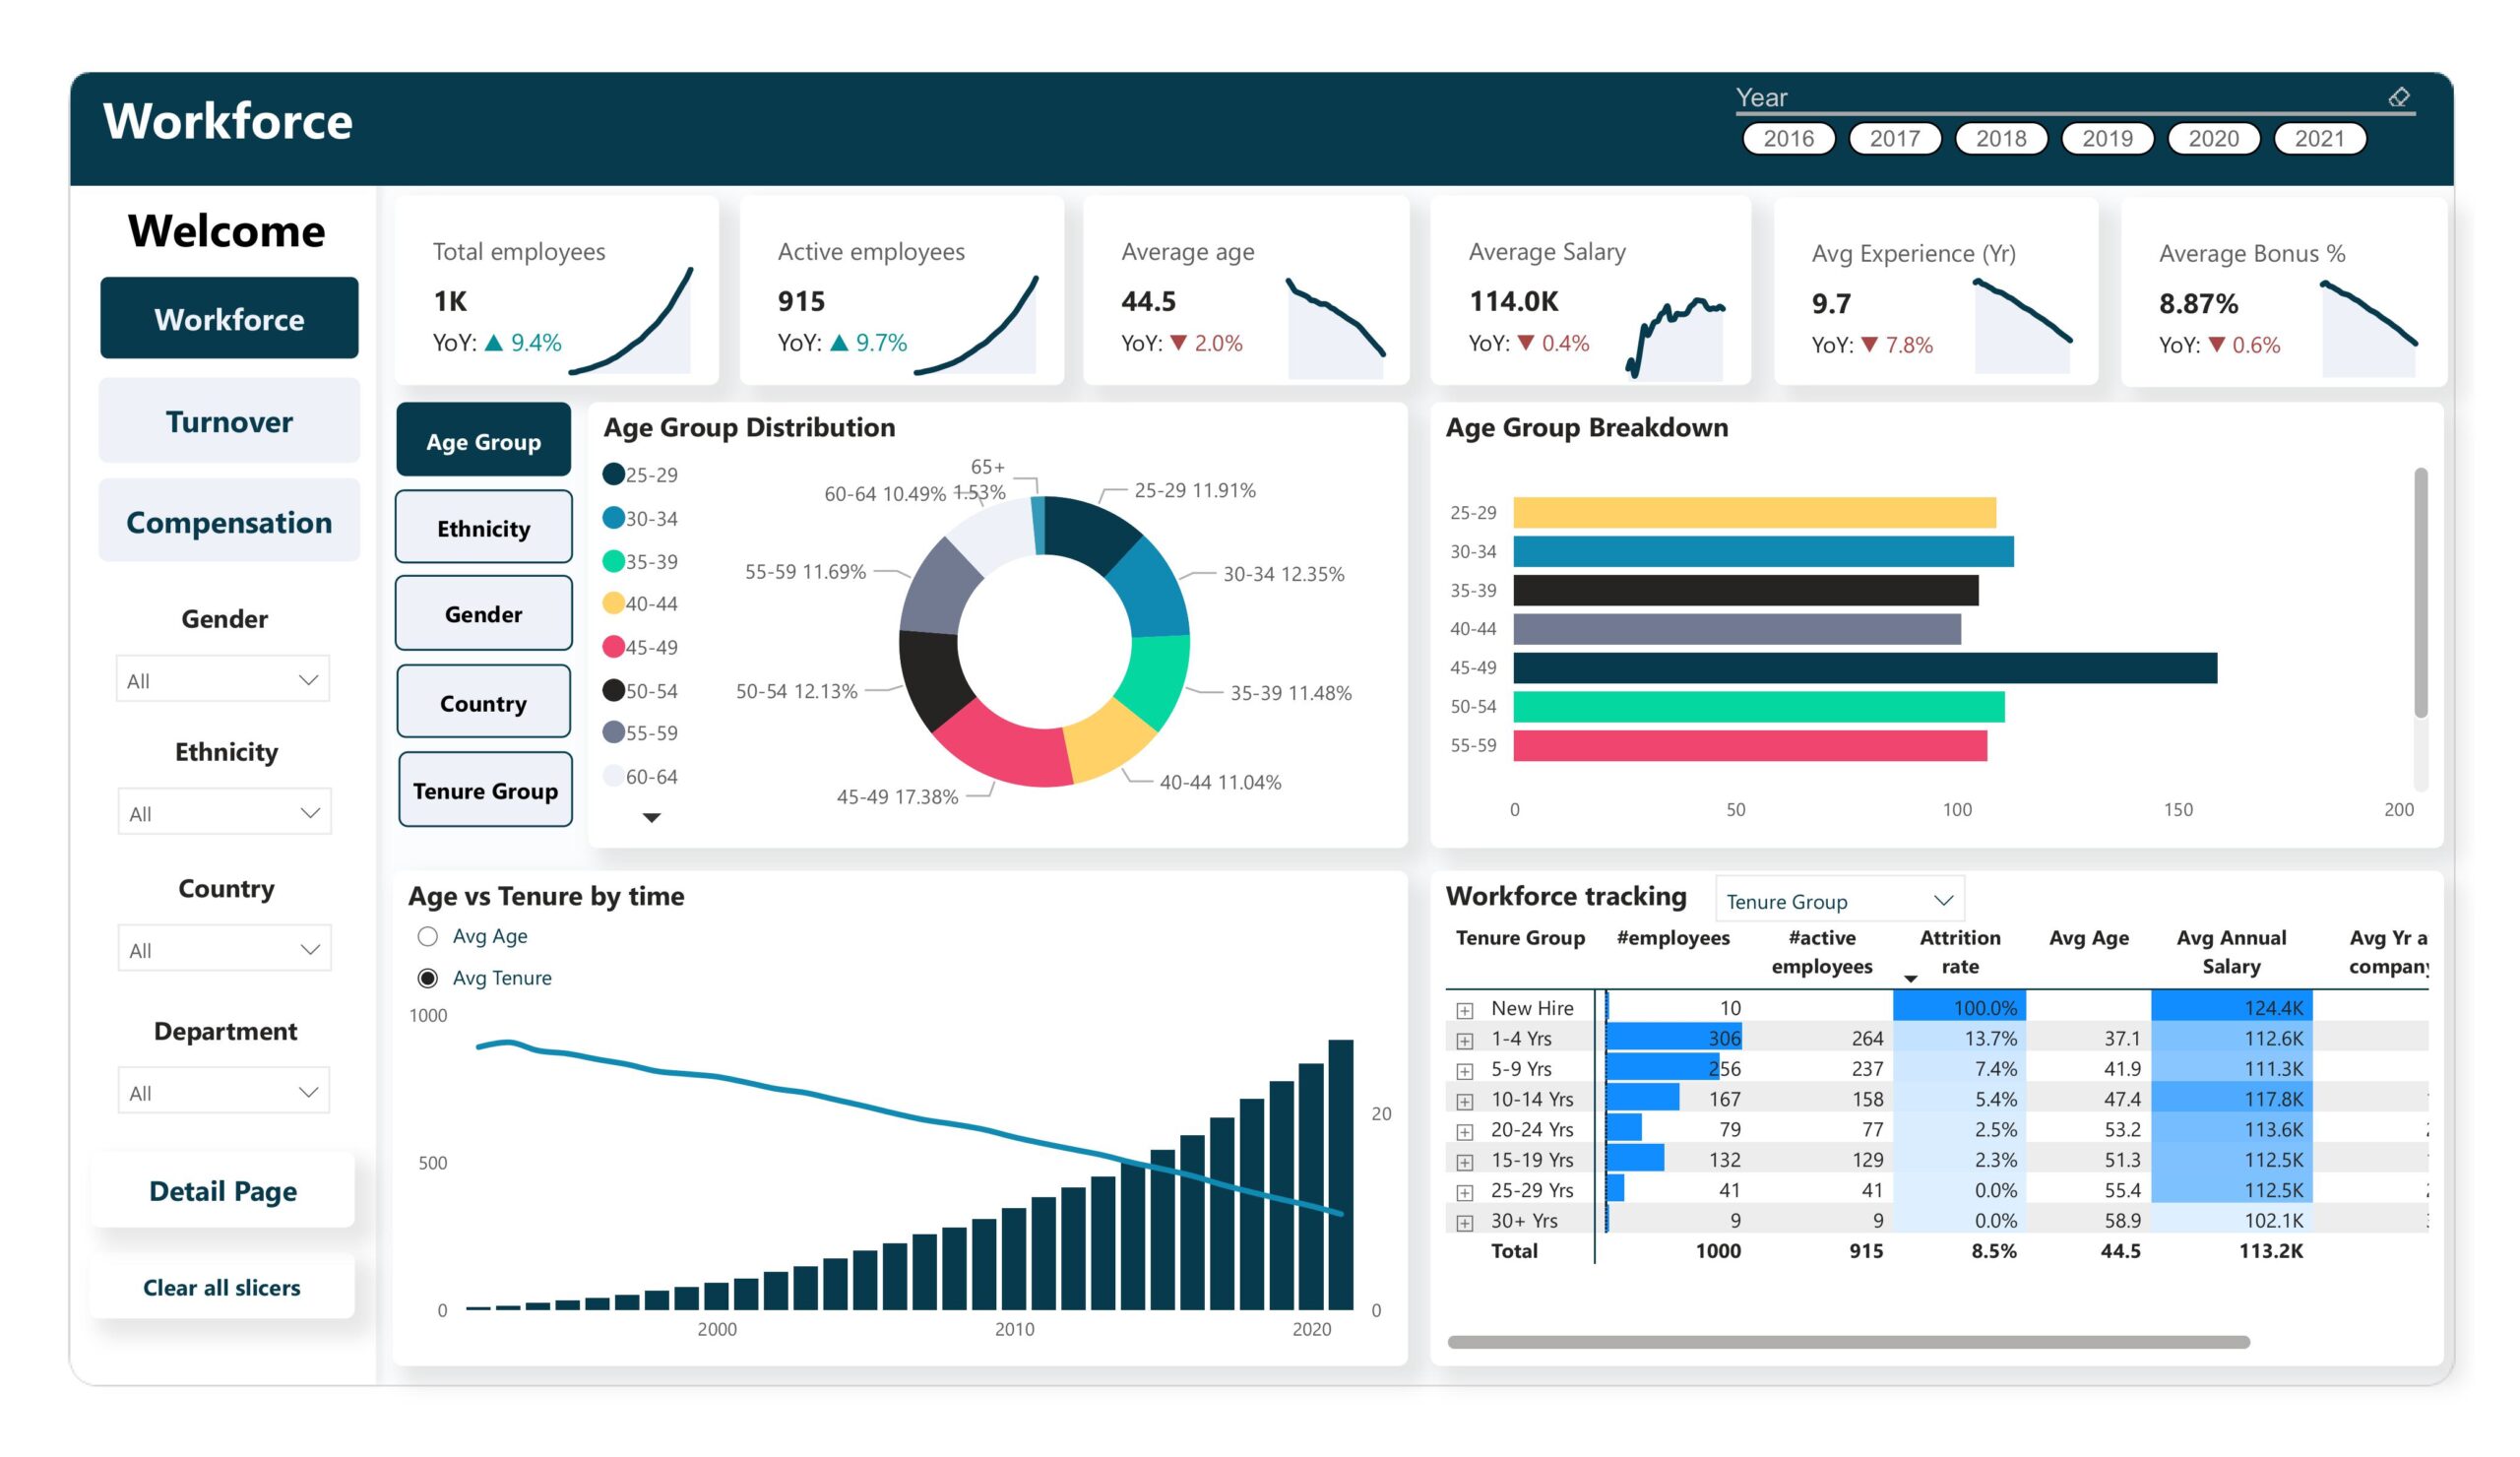
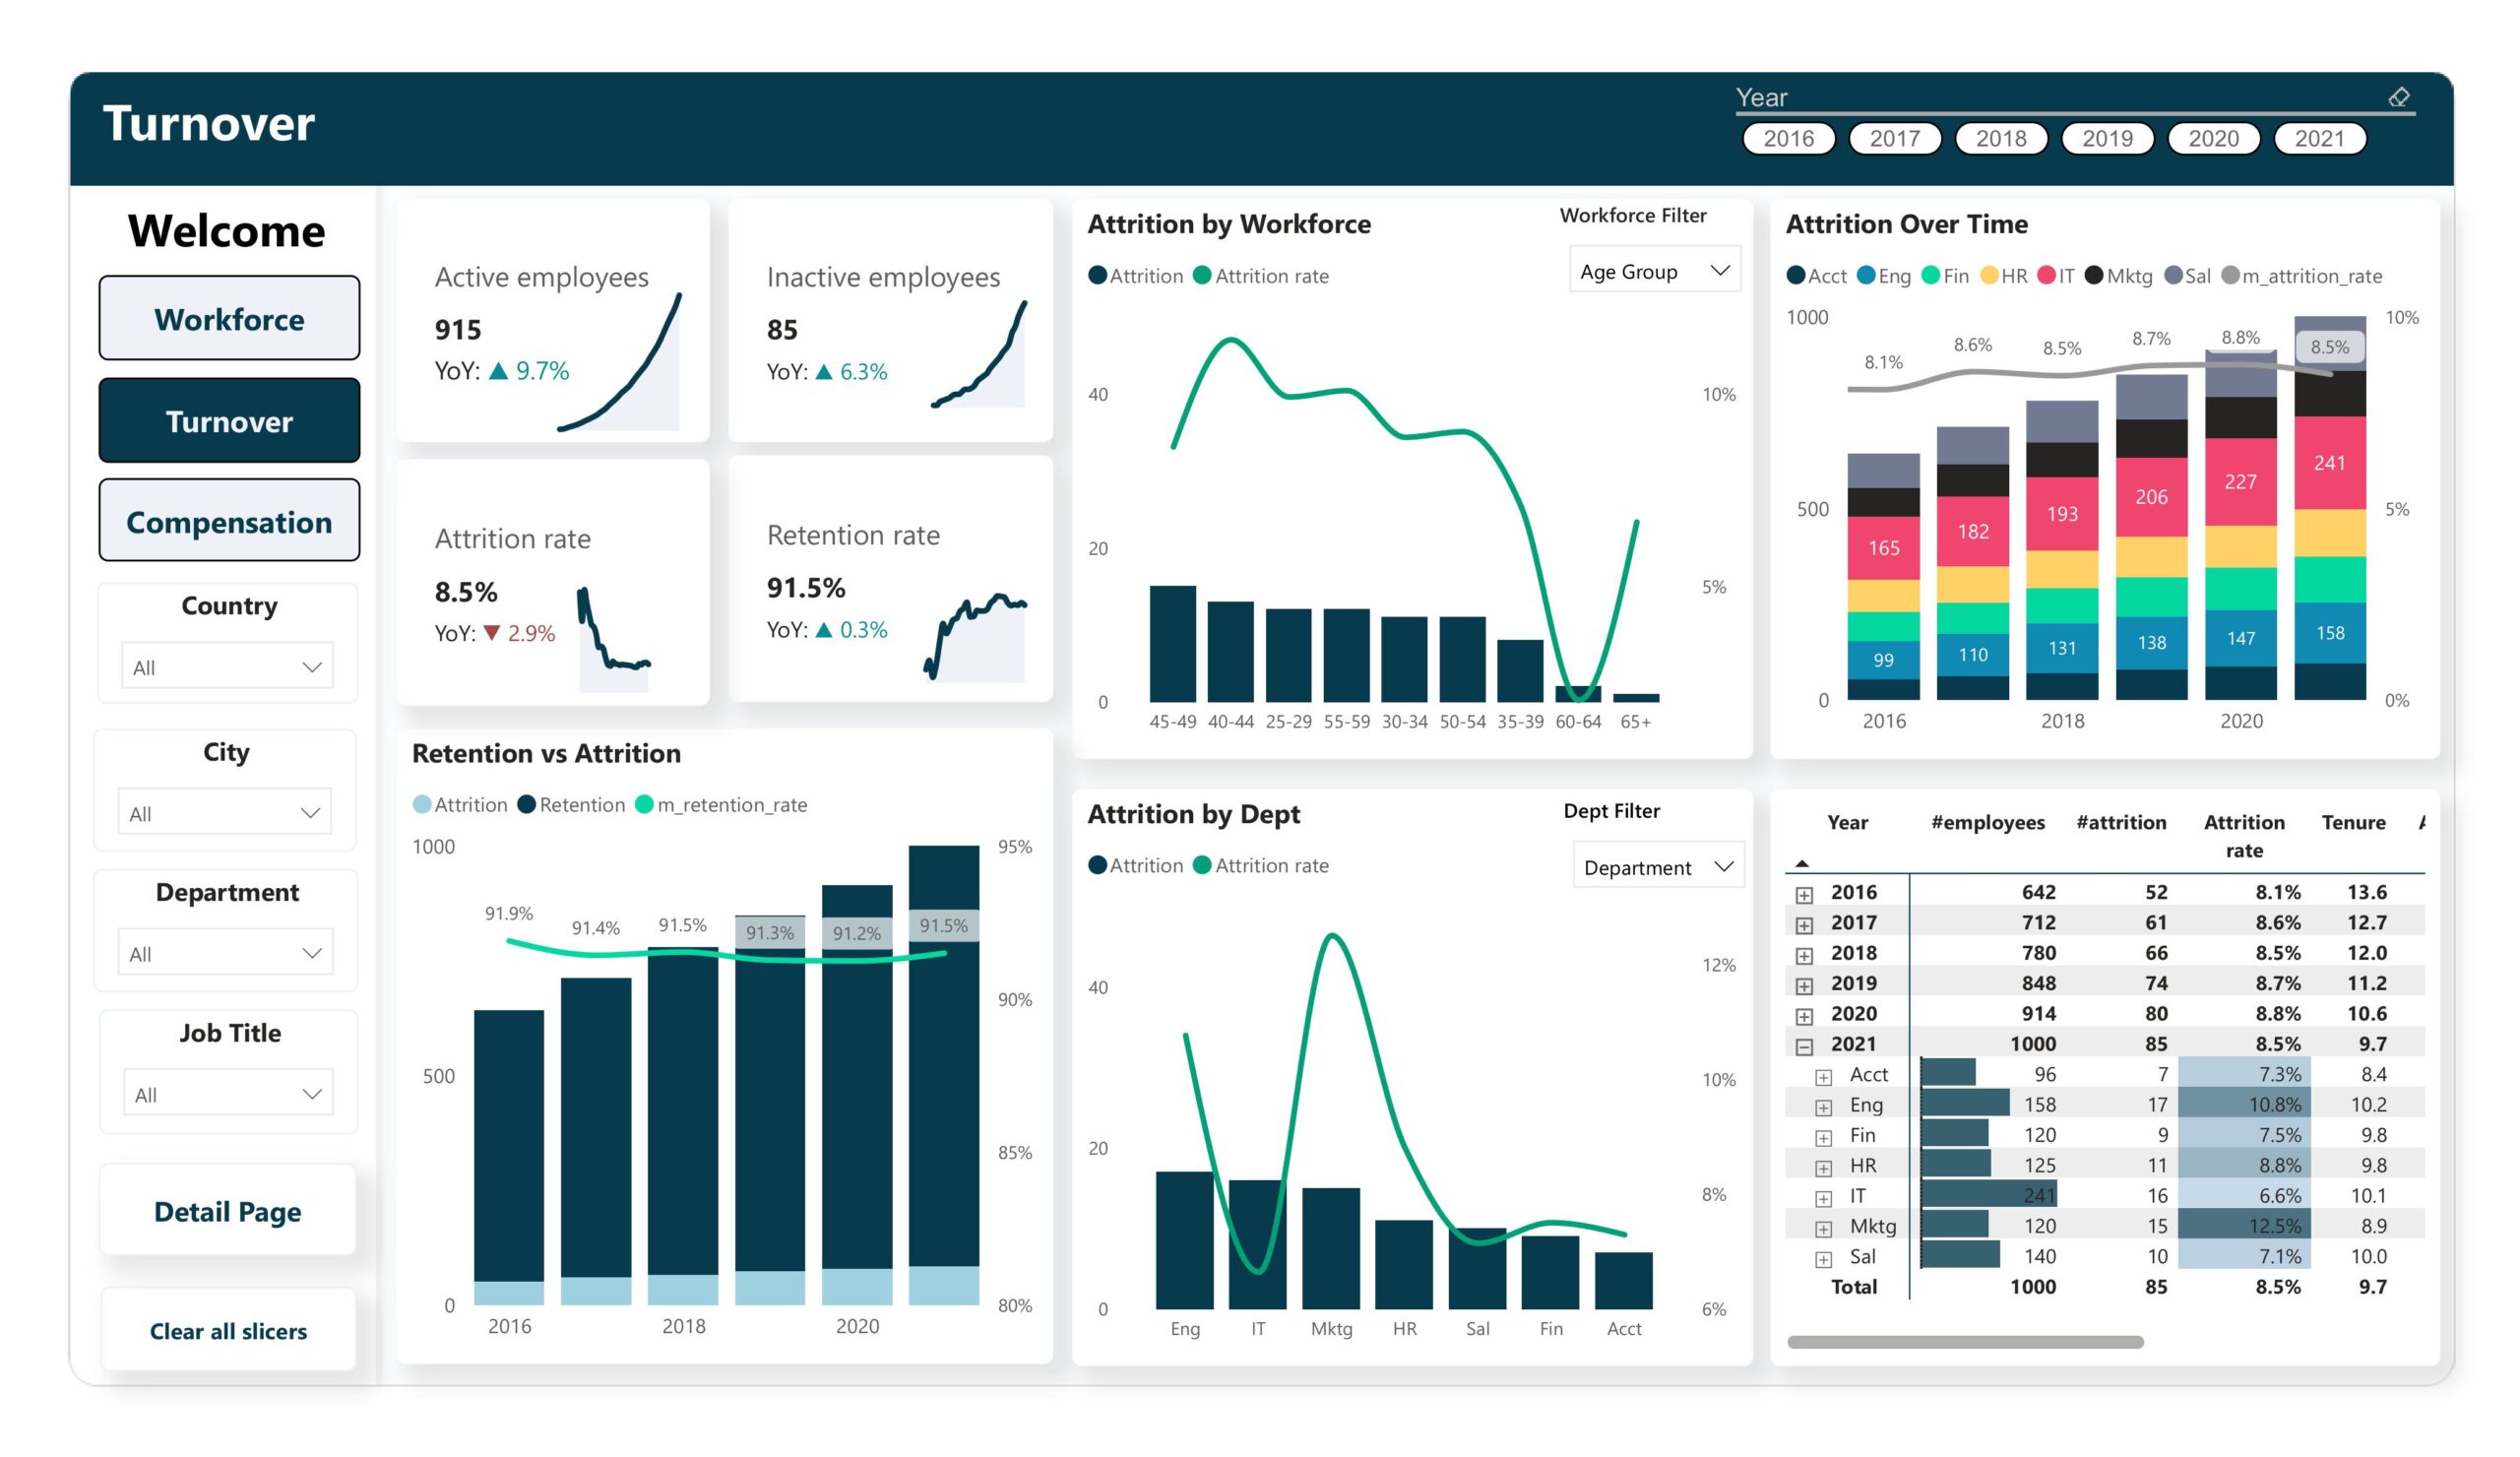
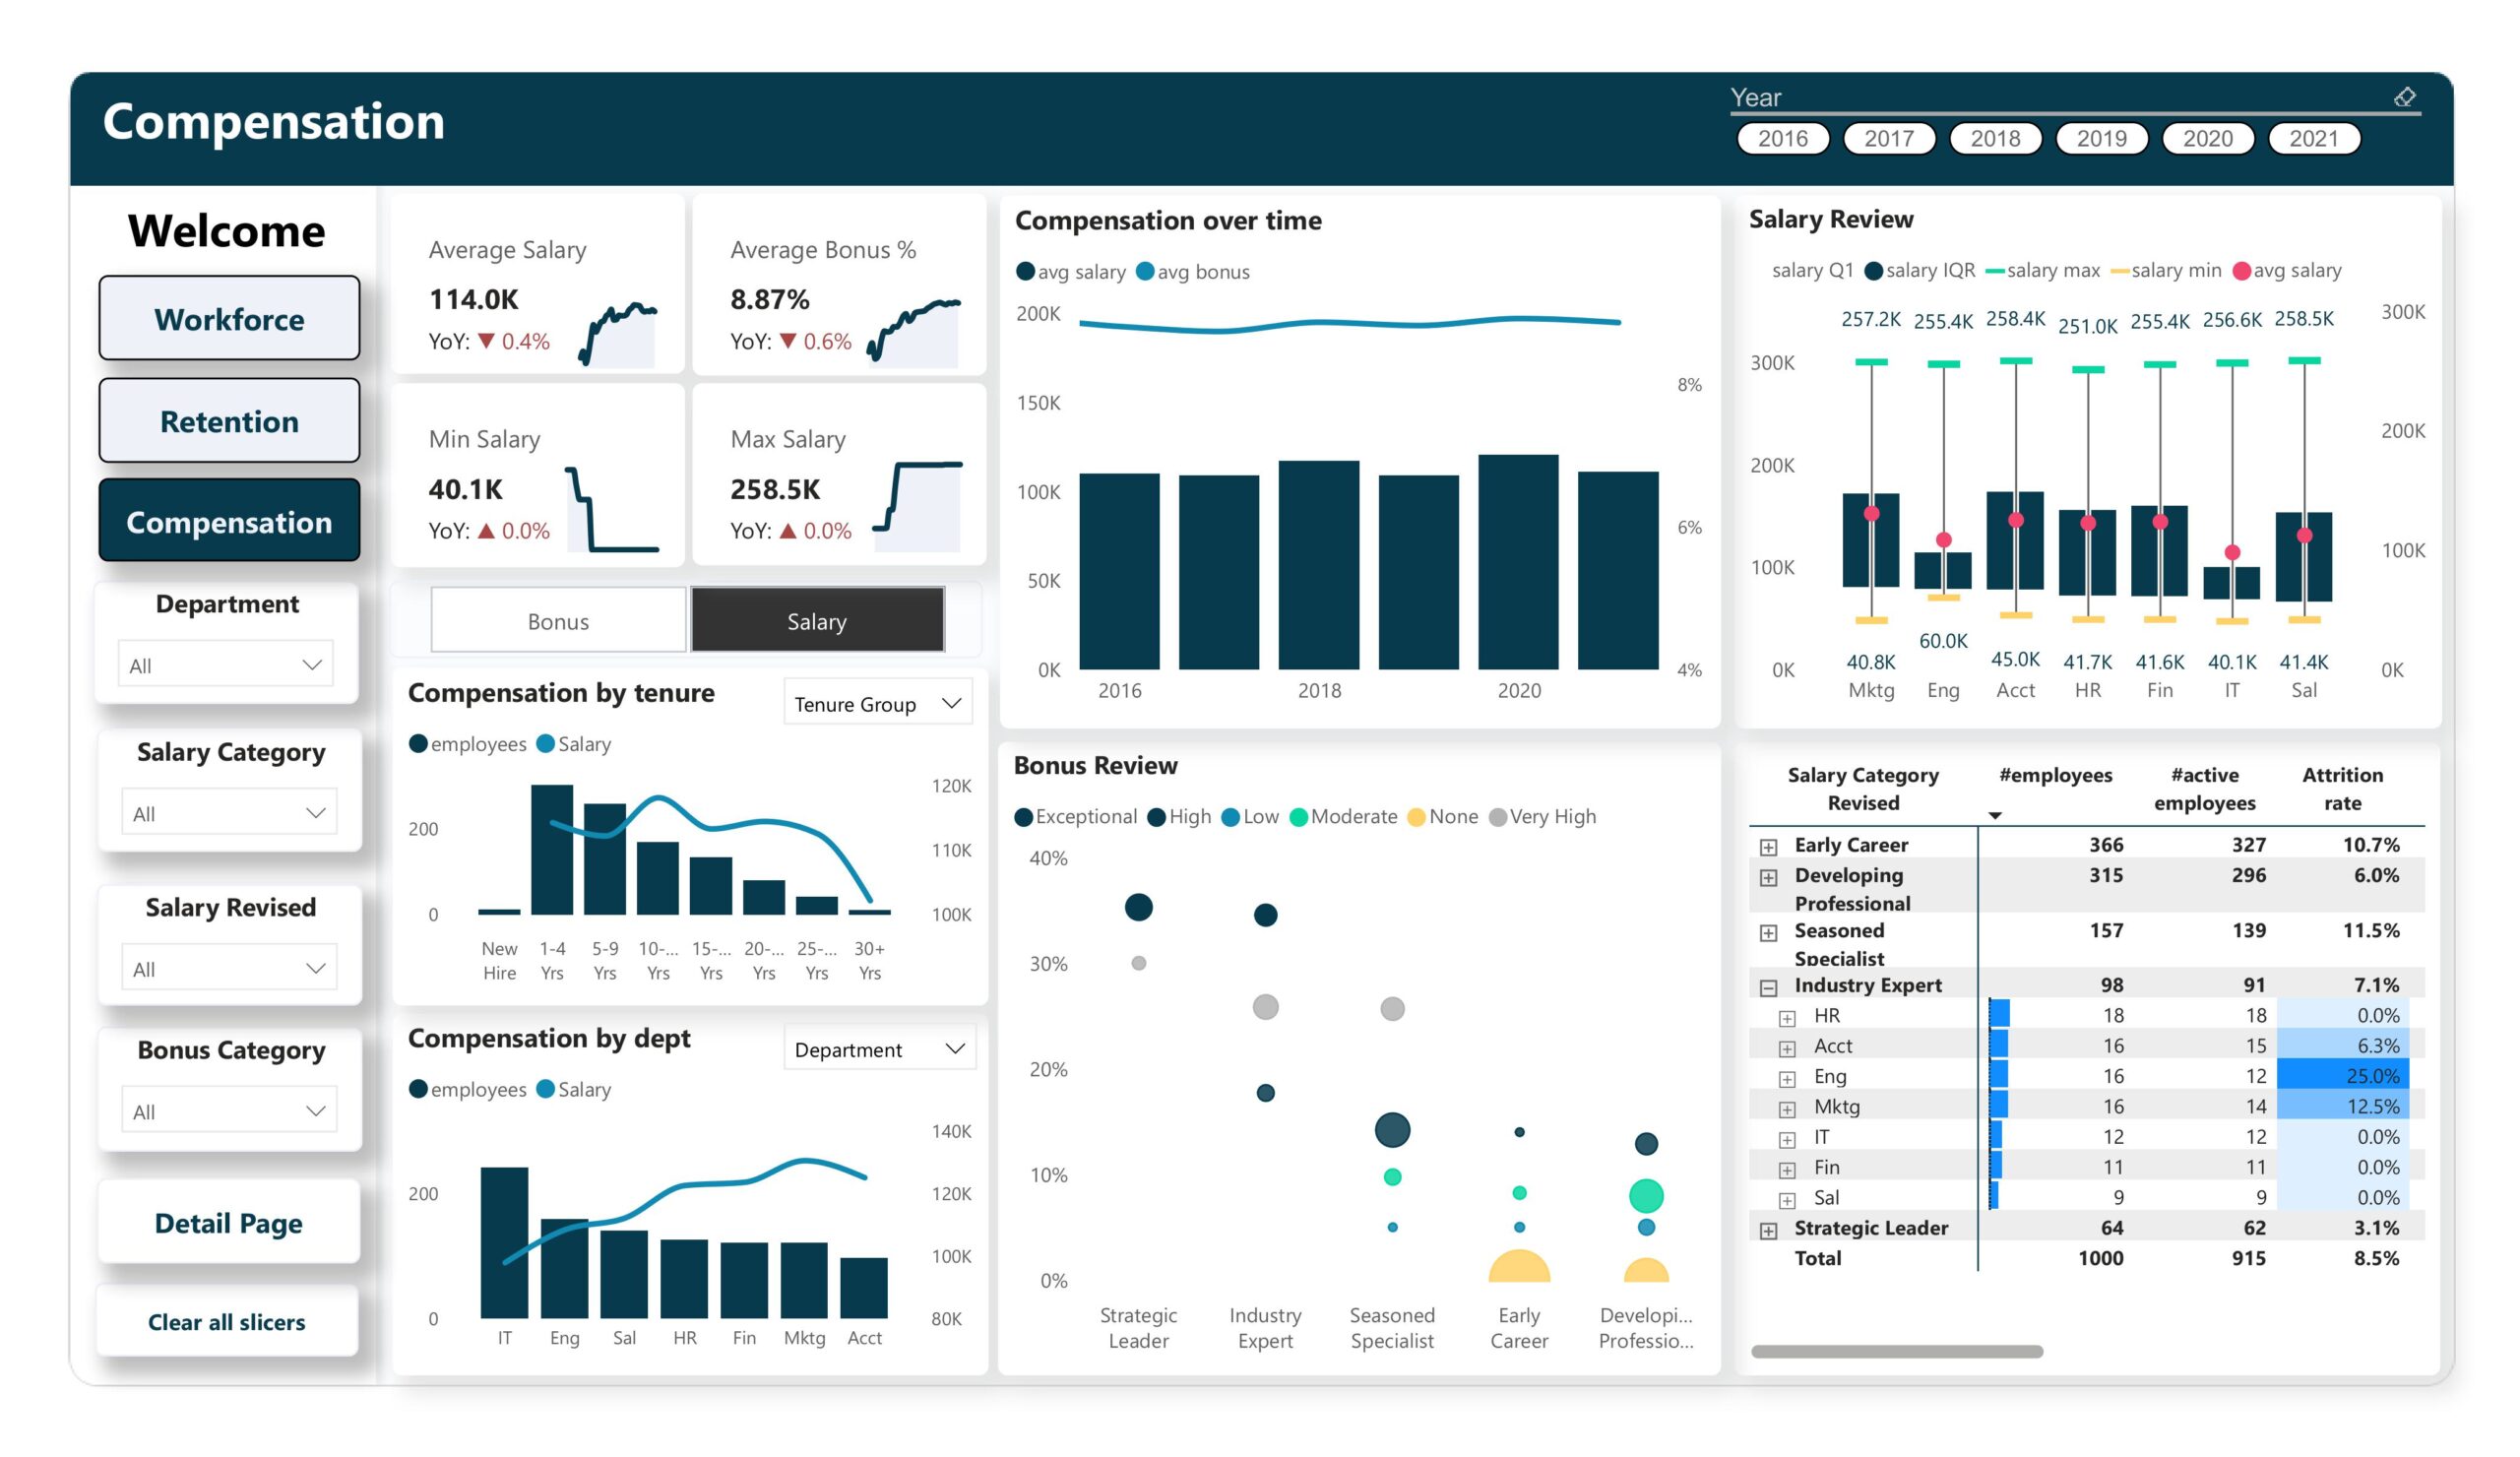
The project analyzes workforce performance and turnover trends using a Power BI dashboard built from HR records. The dataset includes detailed employee information such as employment history, department, position, performance scores, and total compensation. The dashboard provides an interactive and structured view of key HR metrics, enabling insights into staff efficiency, turnover patterns, and compensation distribution. Analysis results support data-driven decisions to improve employee retention, optimize HR costs, and enhance workforce management strategies.
Skills Applied
Food Delivery Analysis

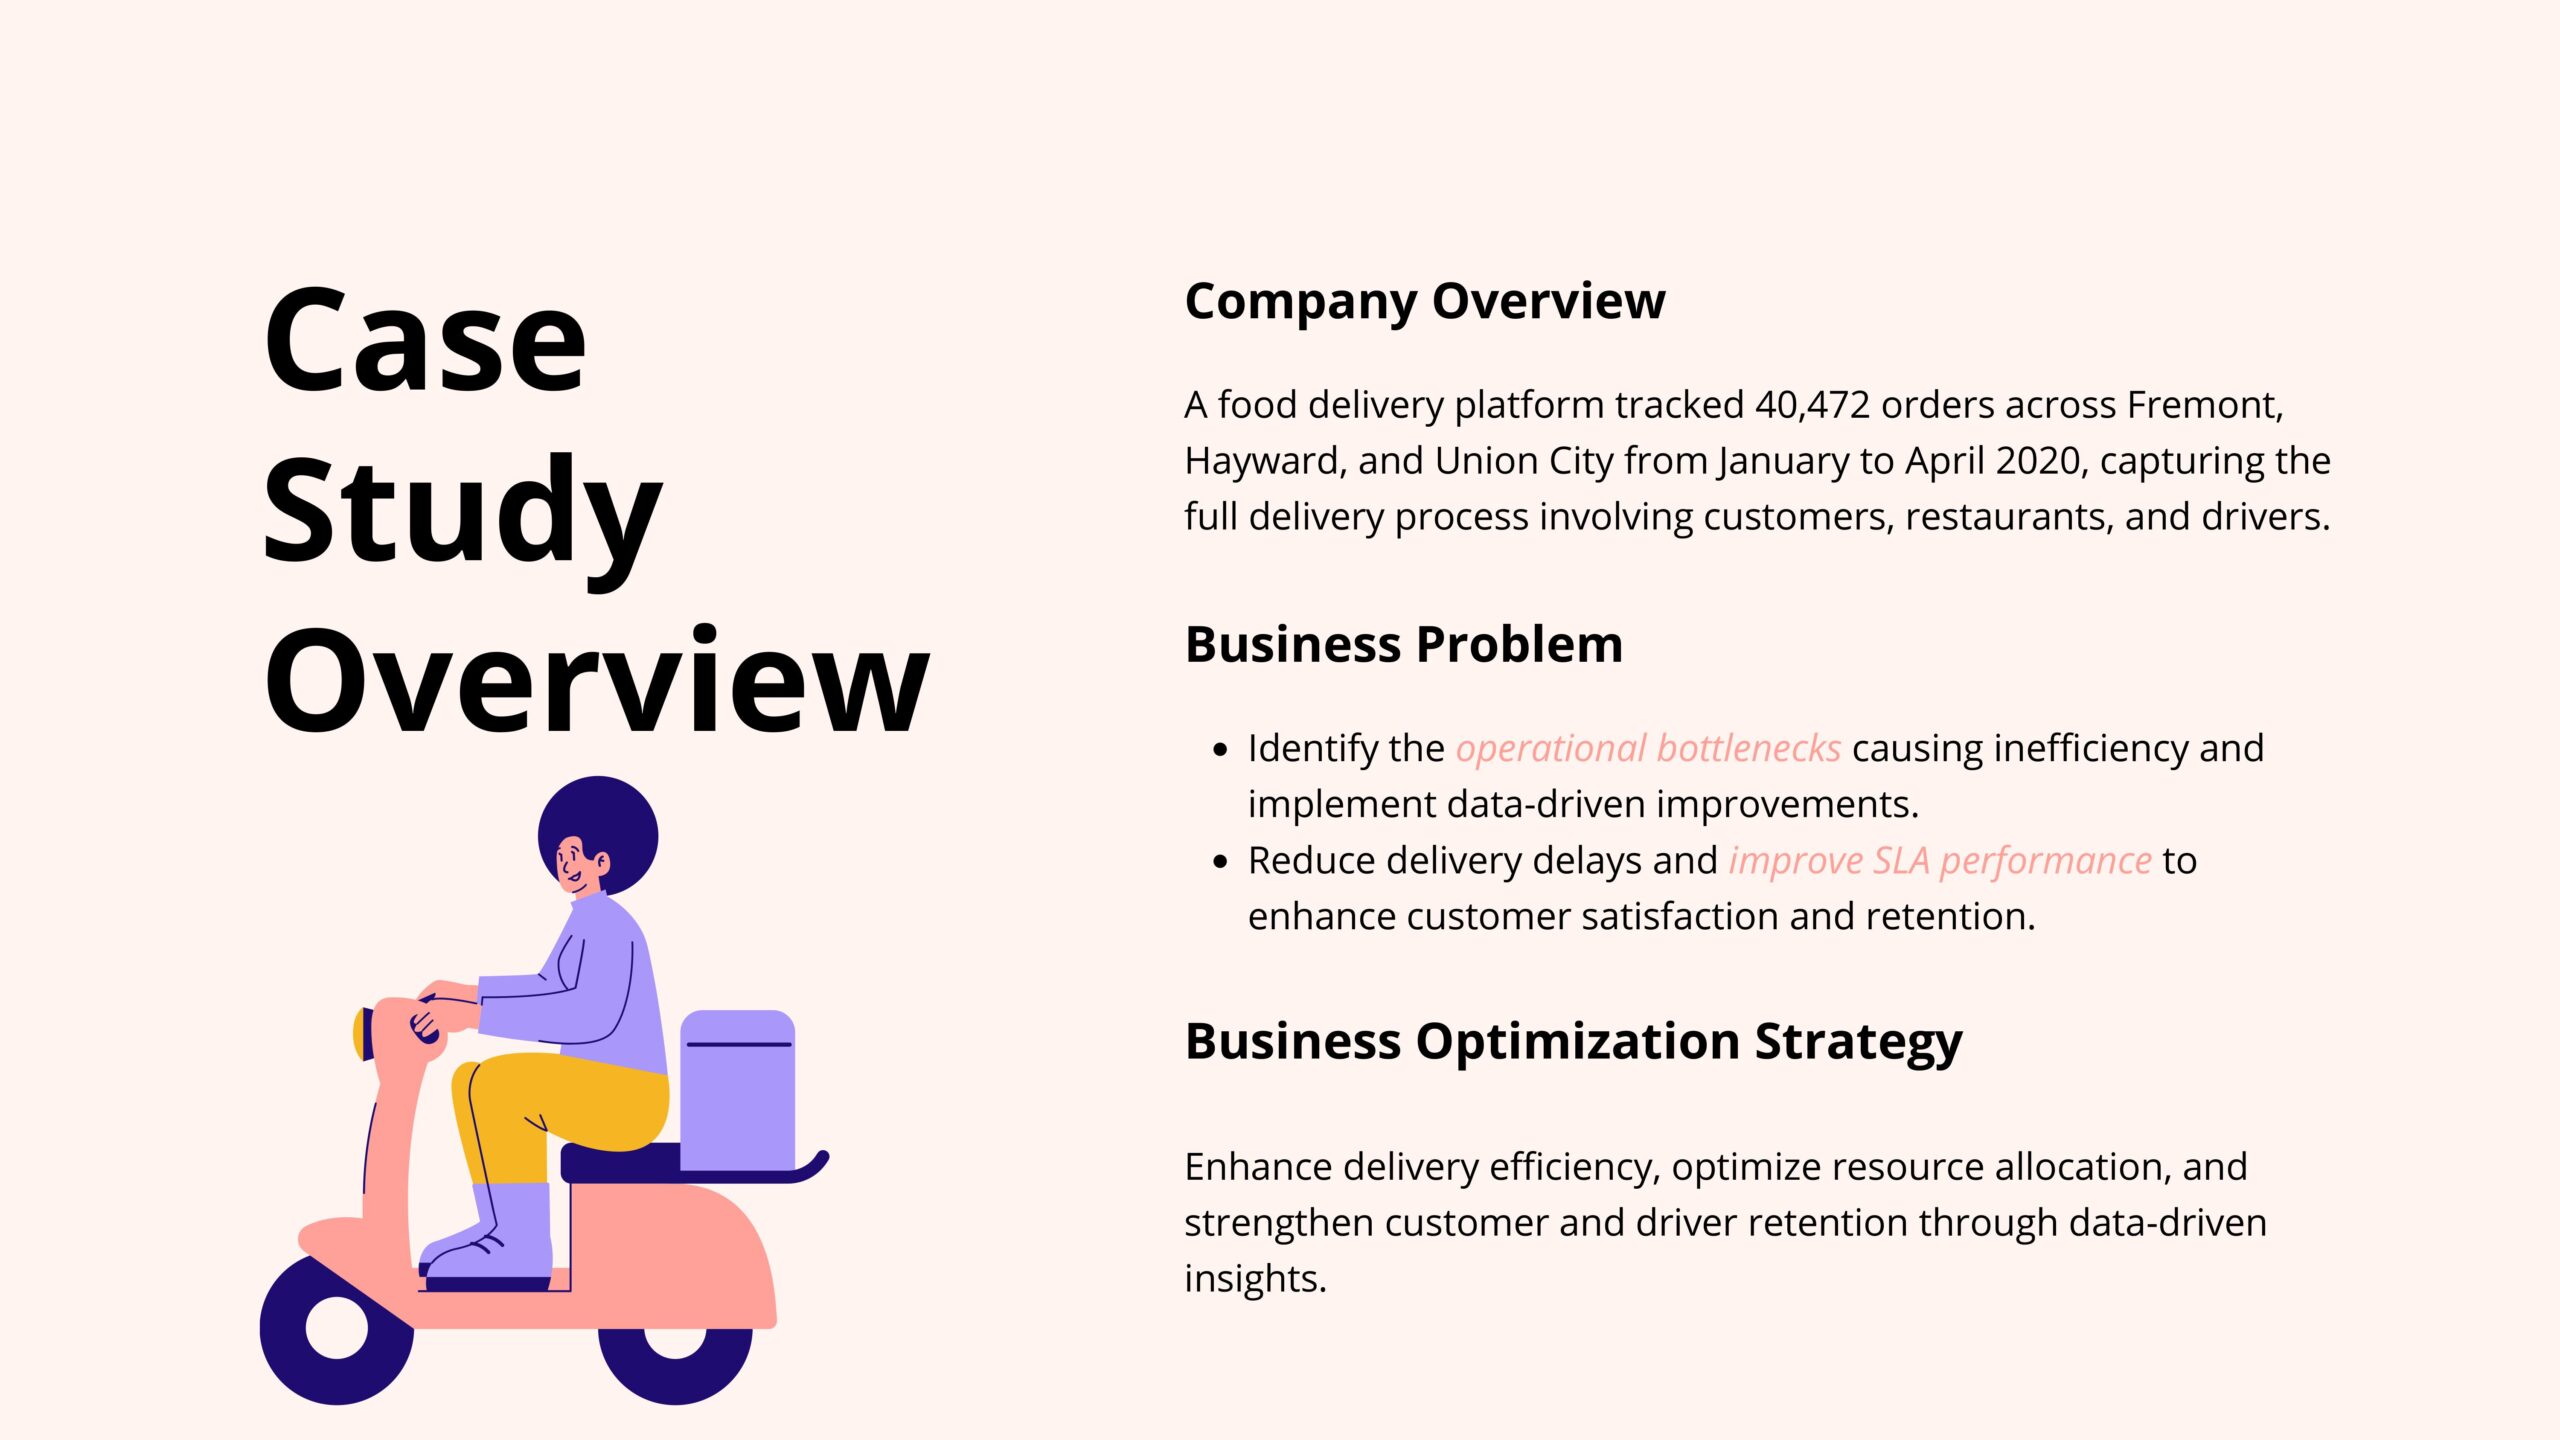
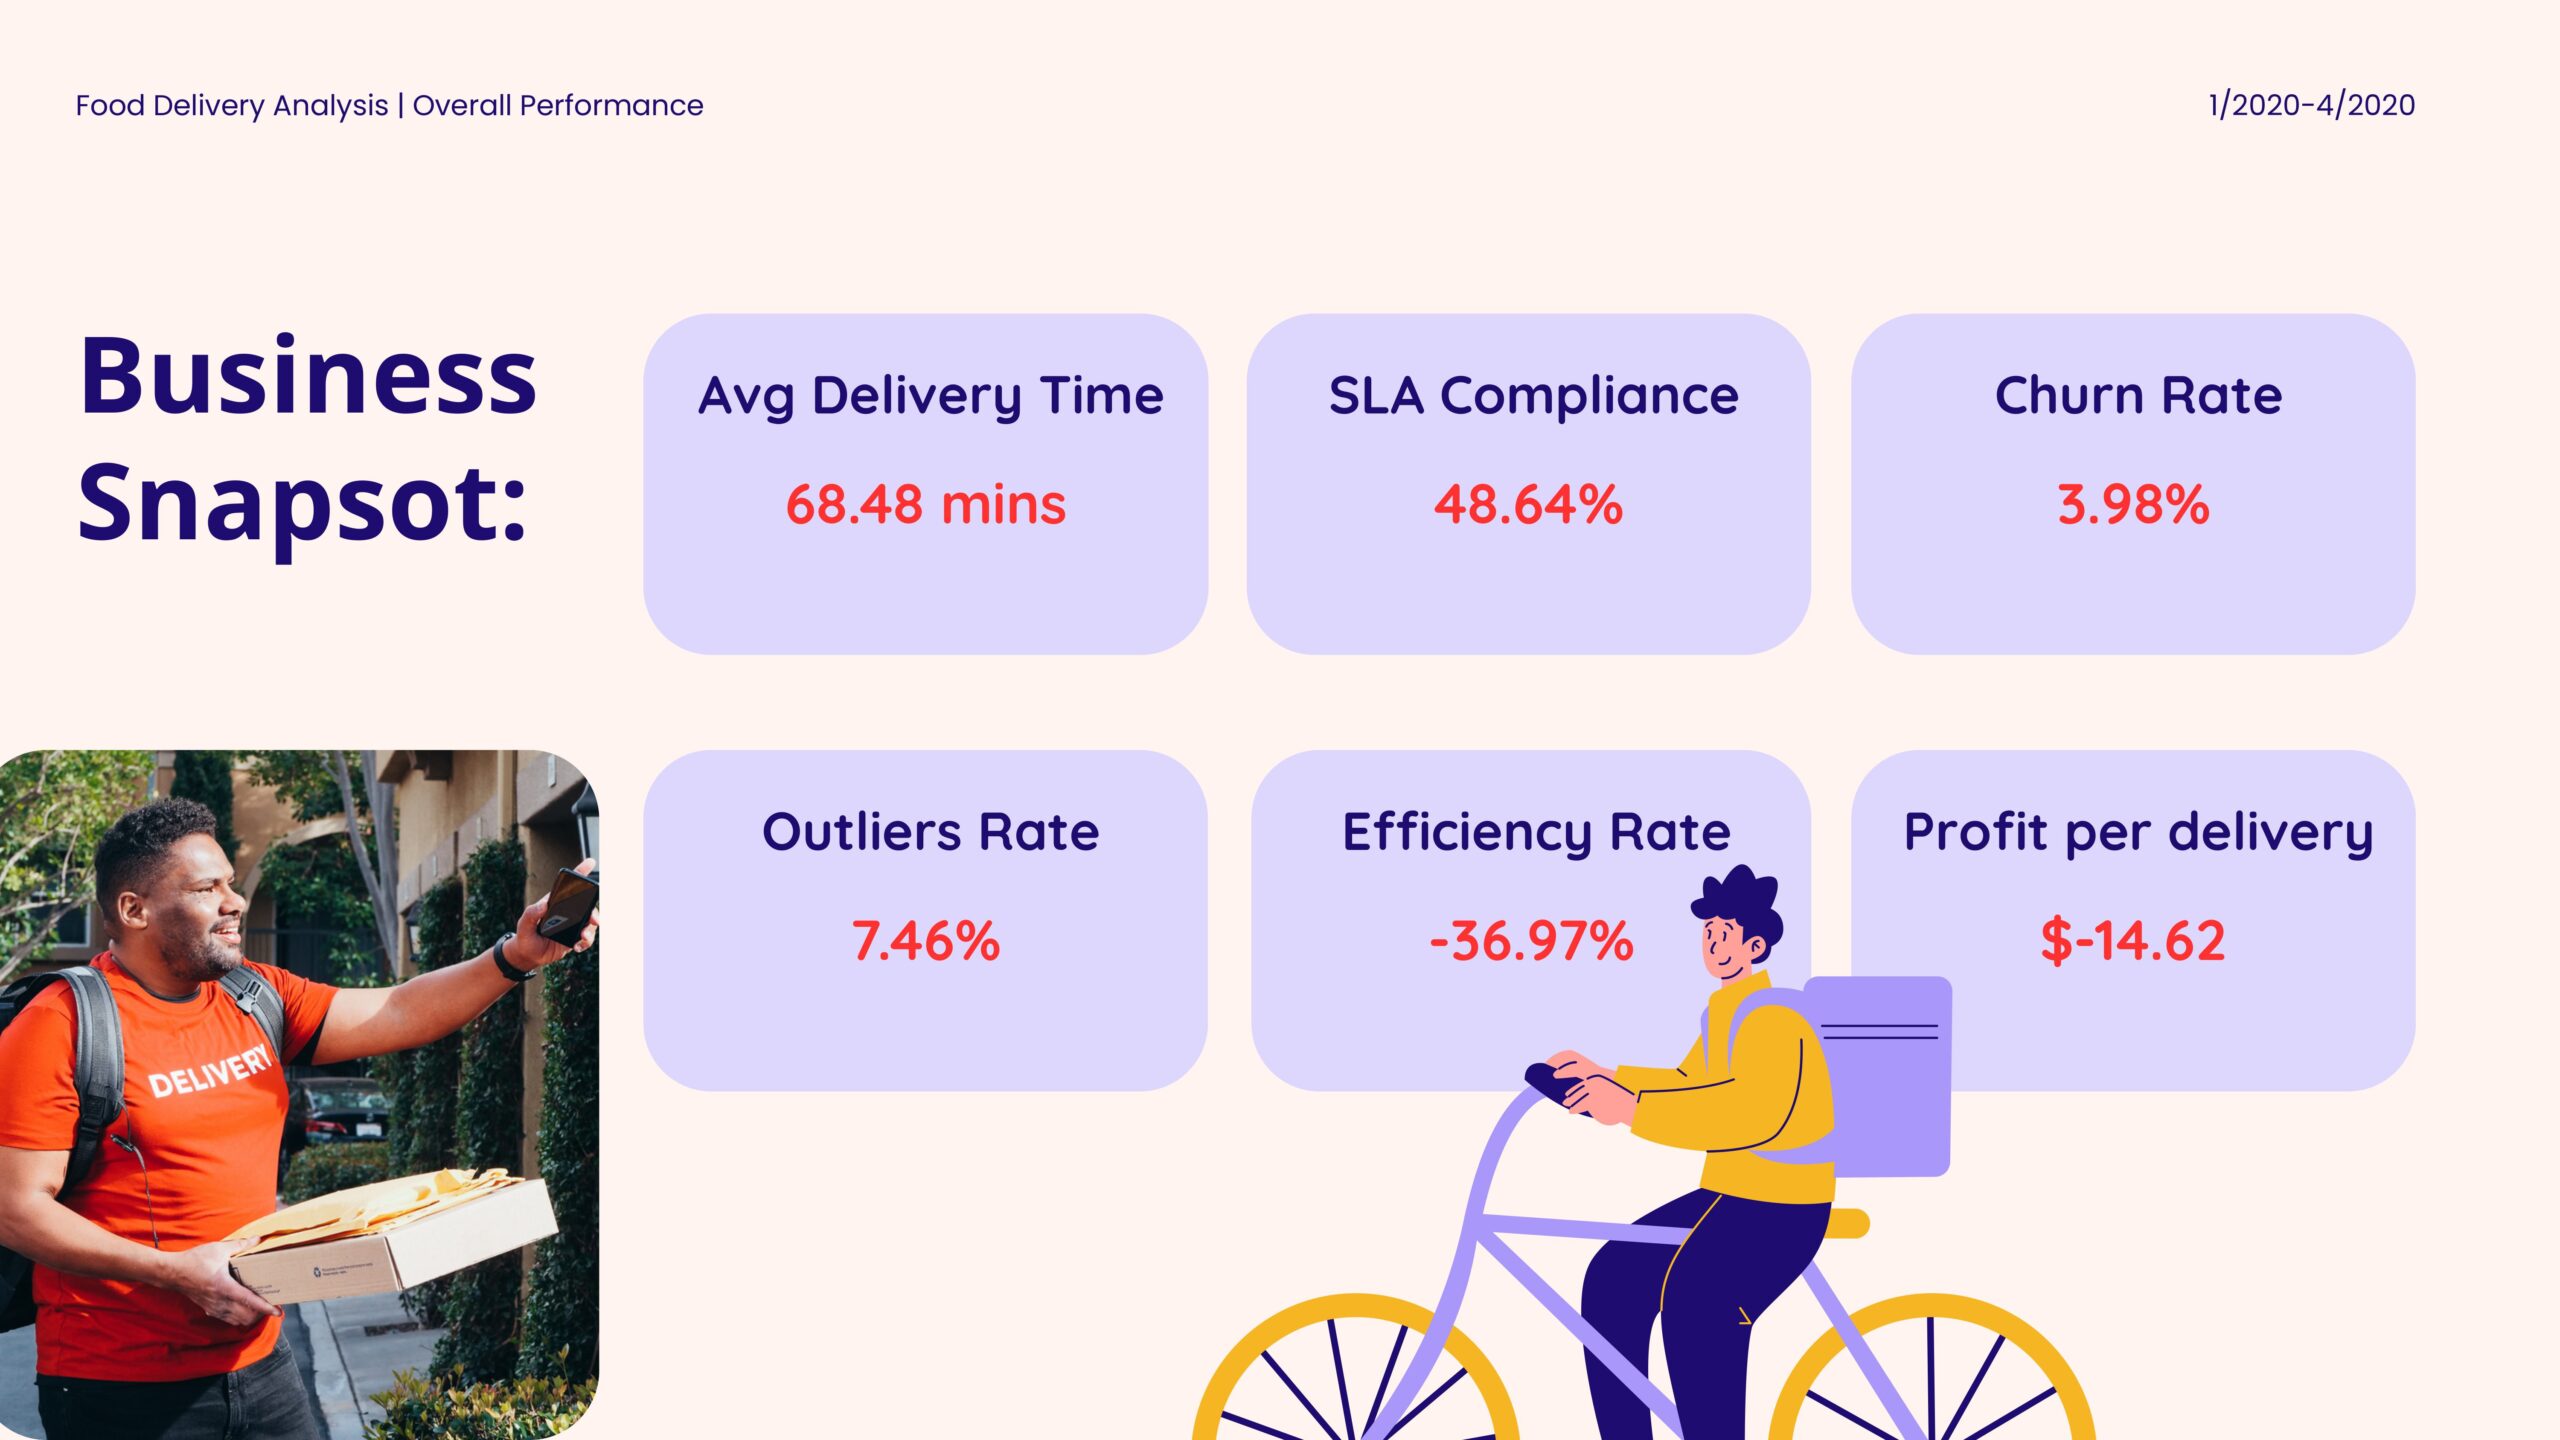
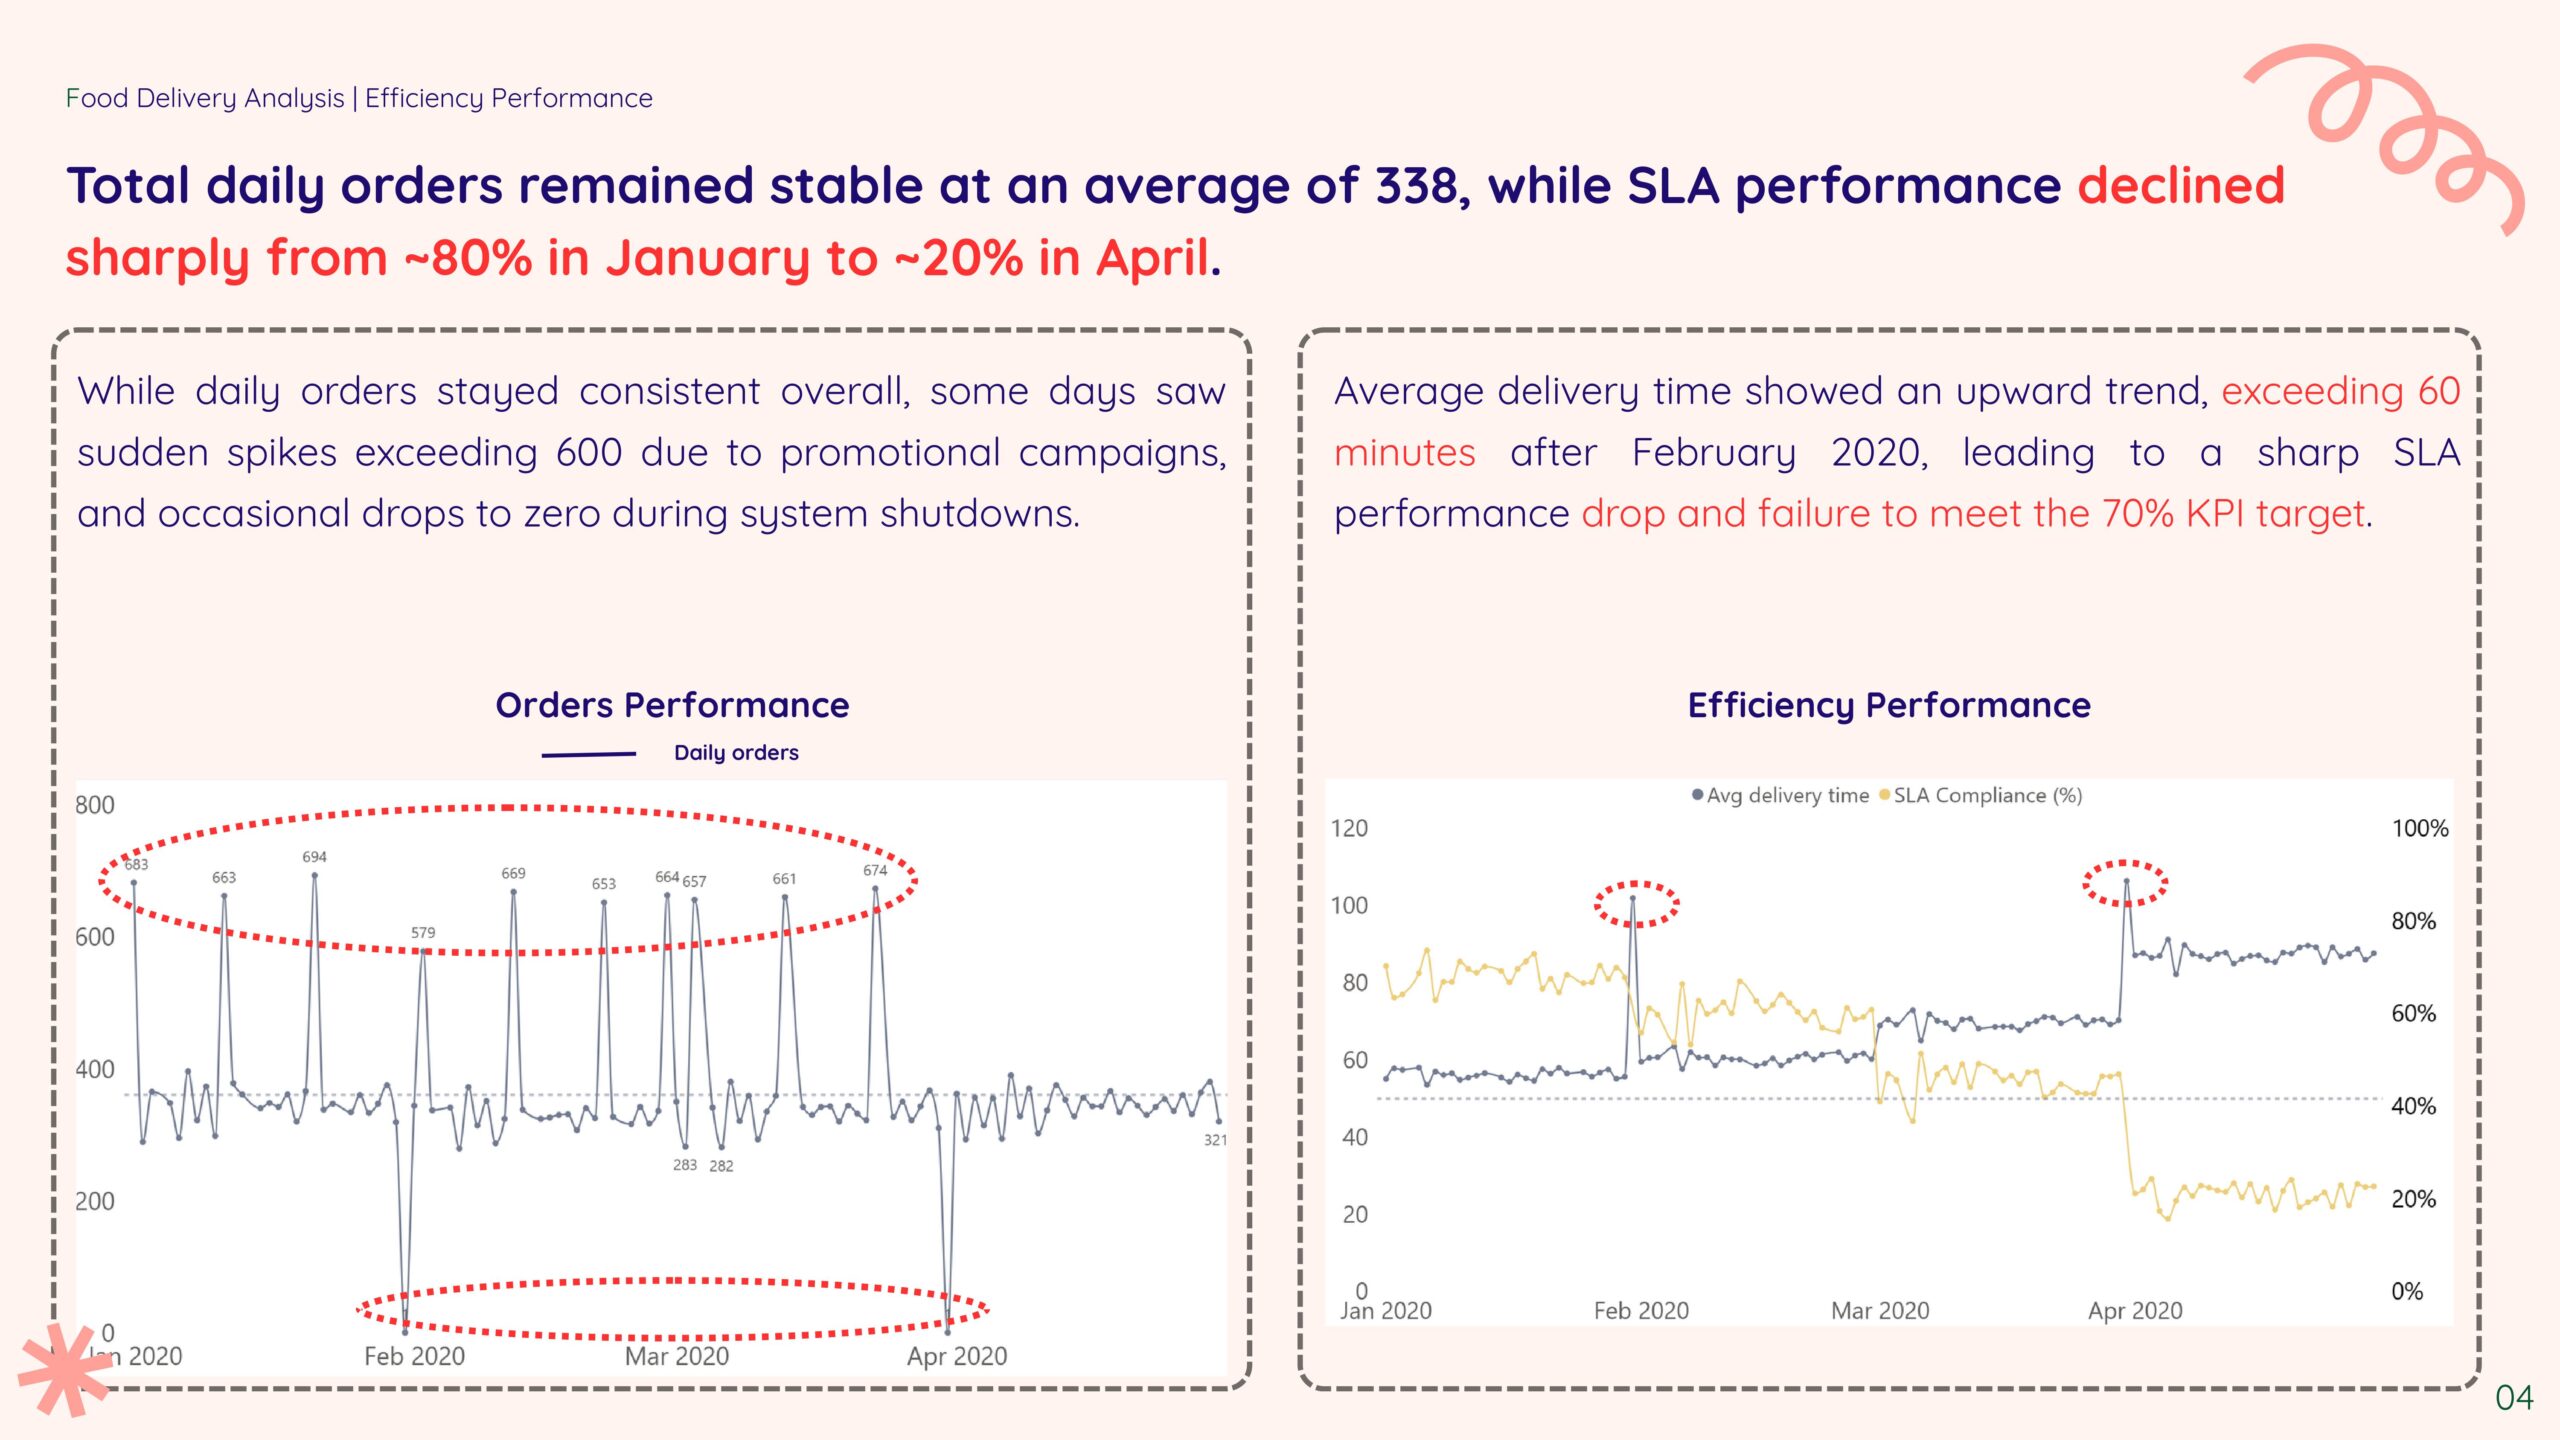
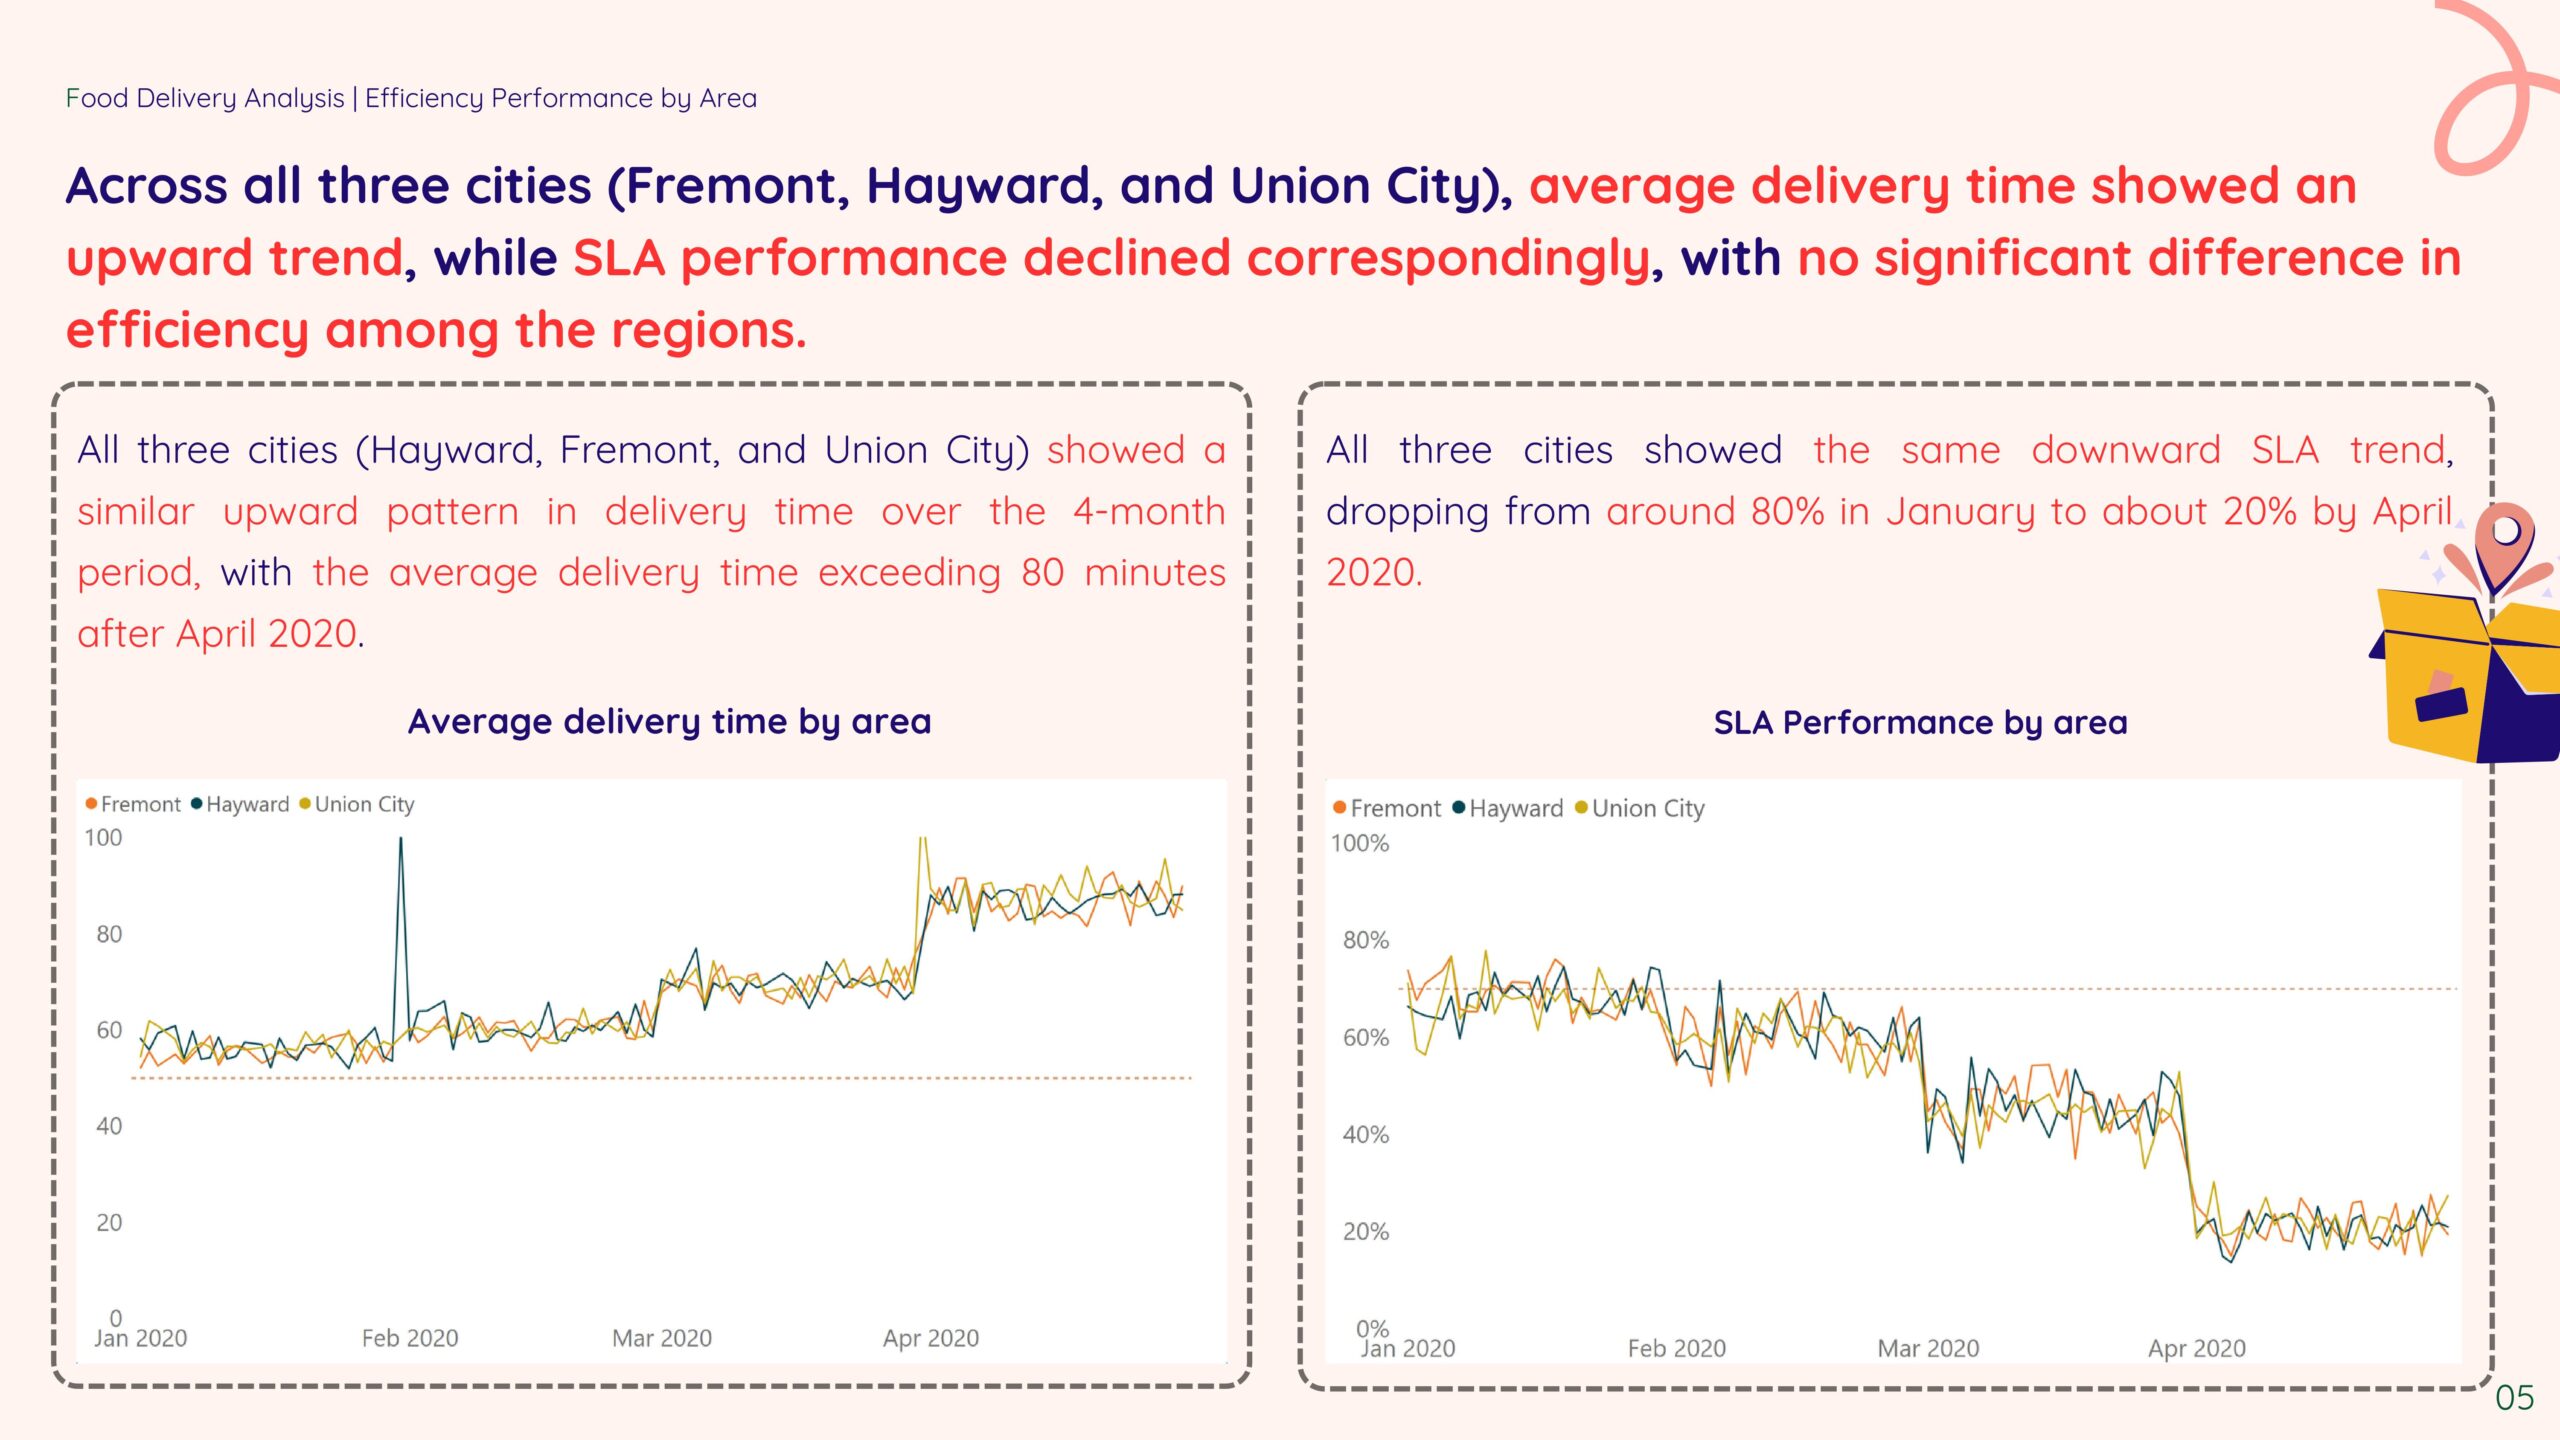
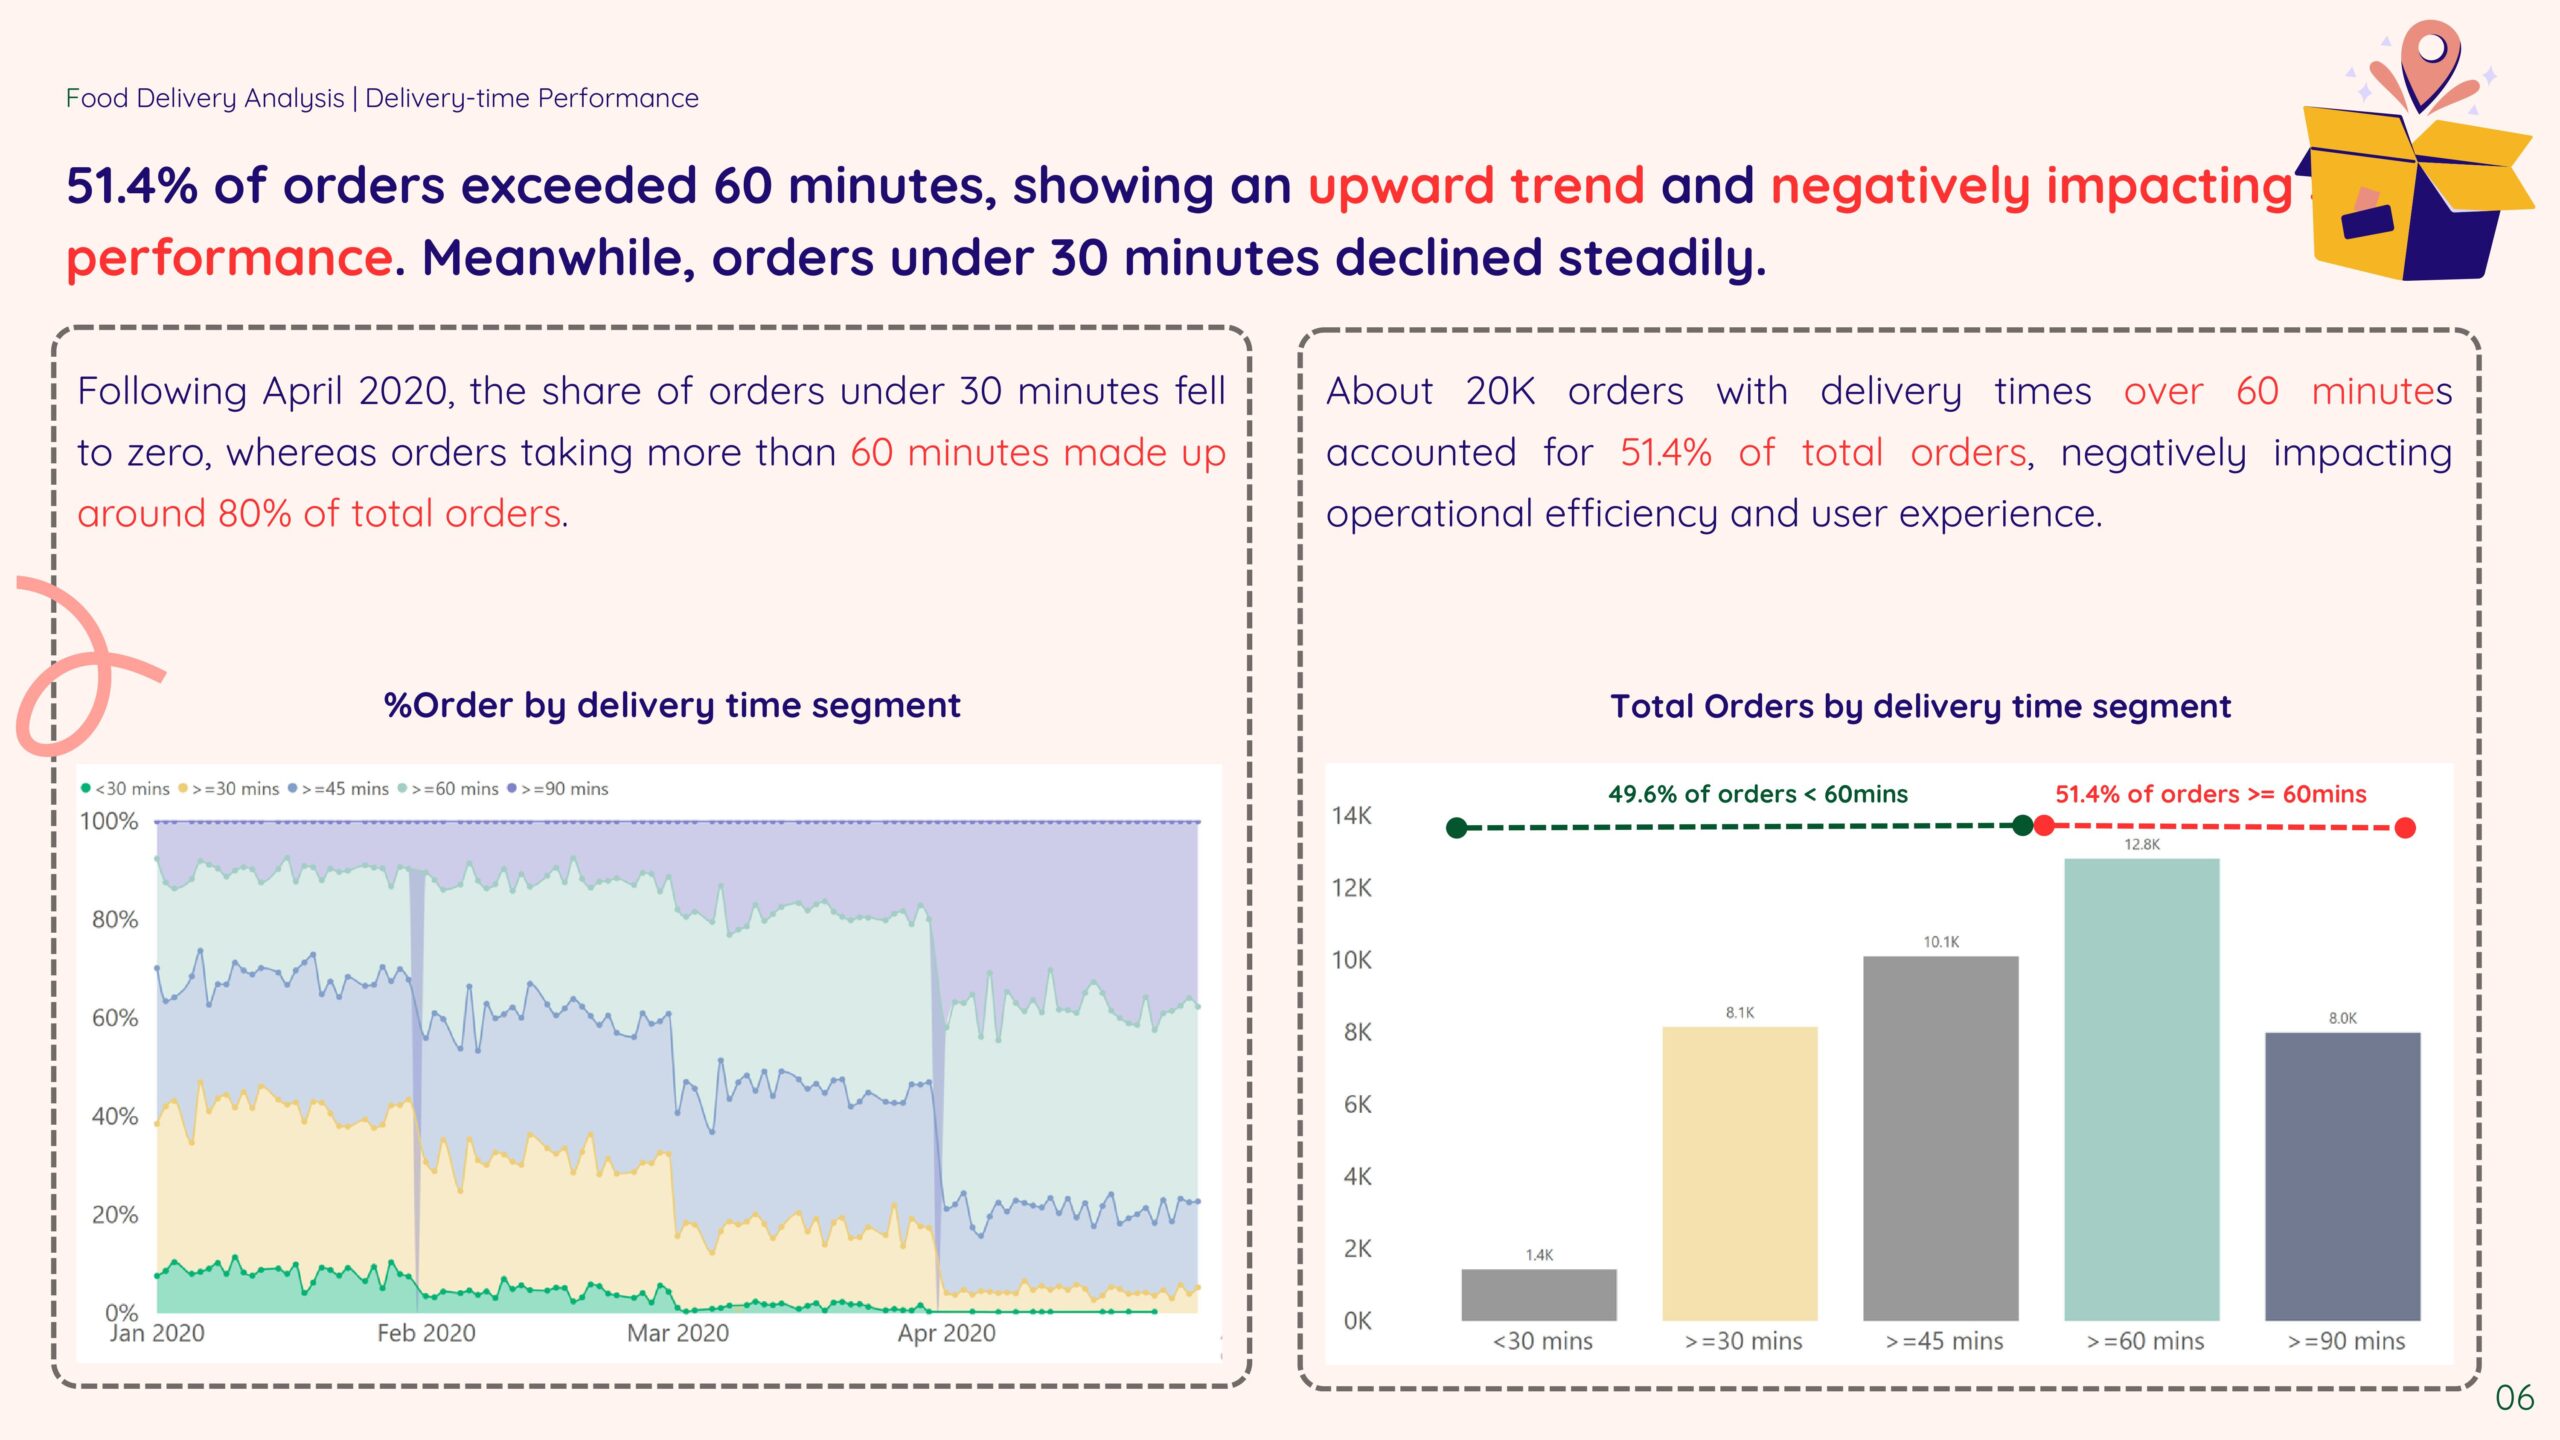
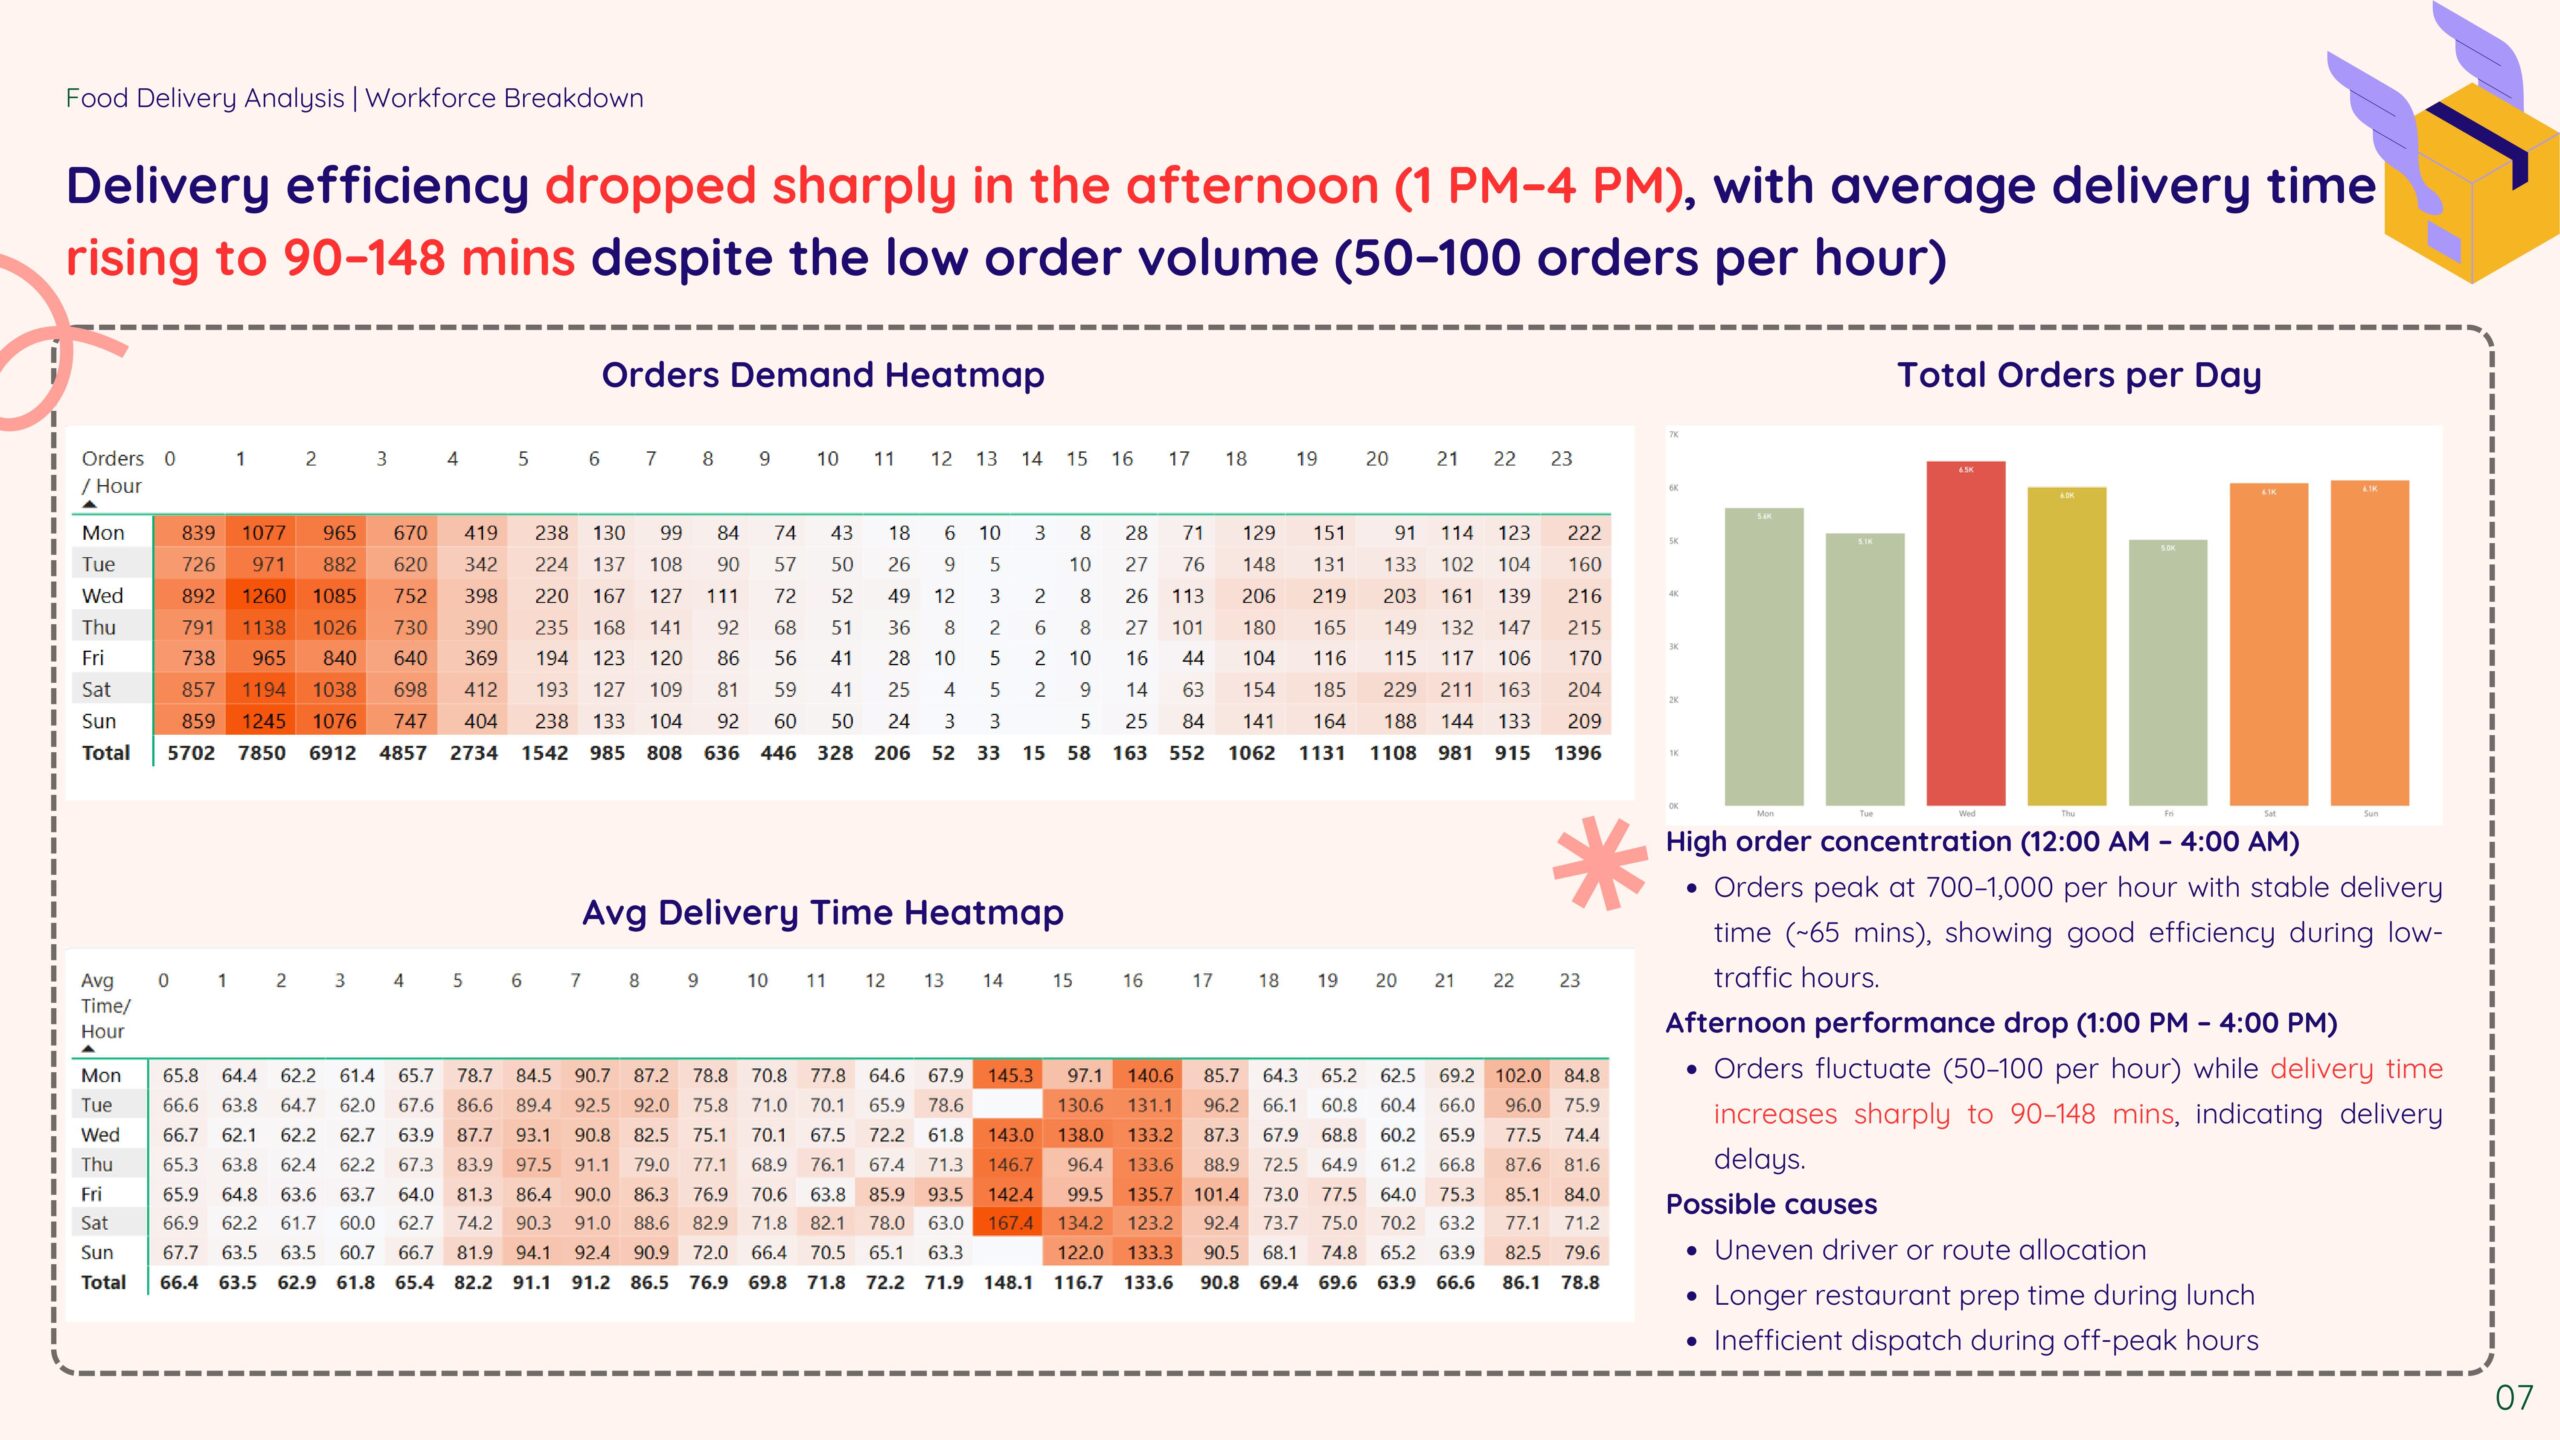
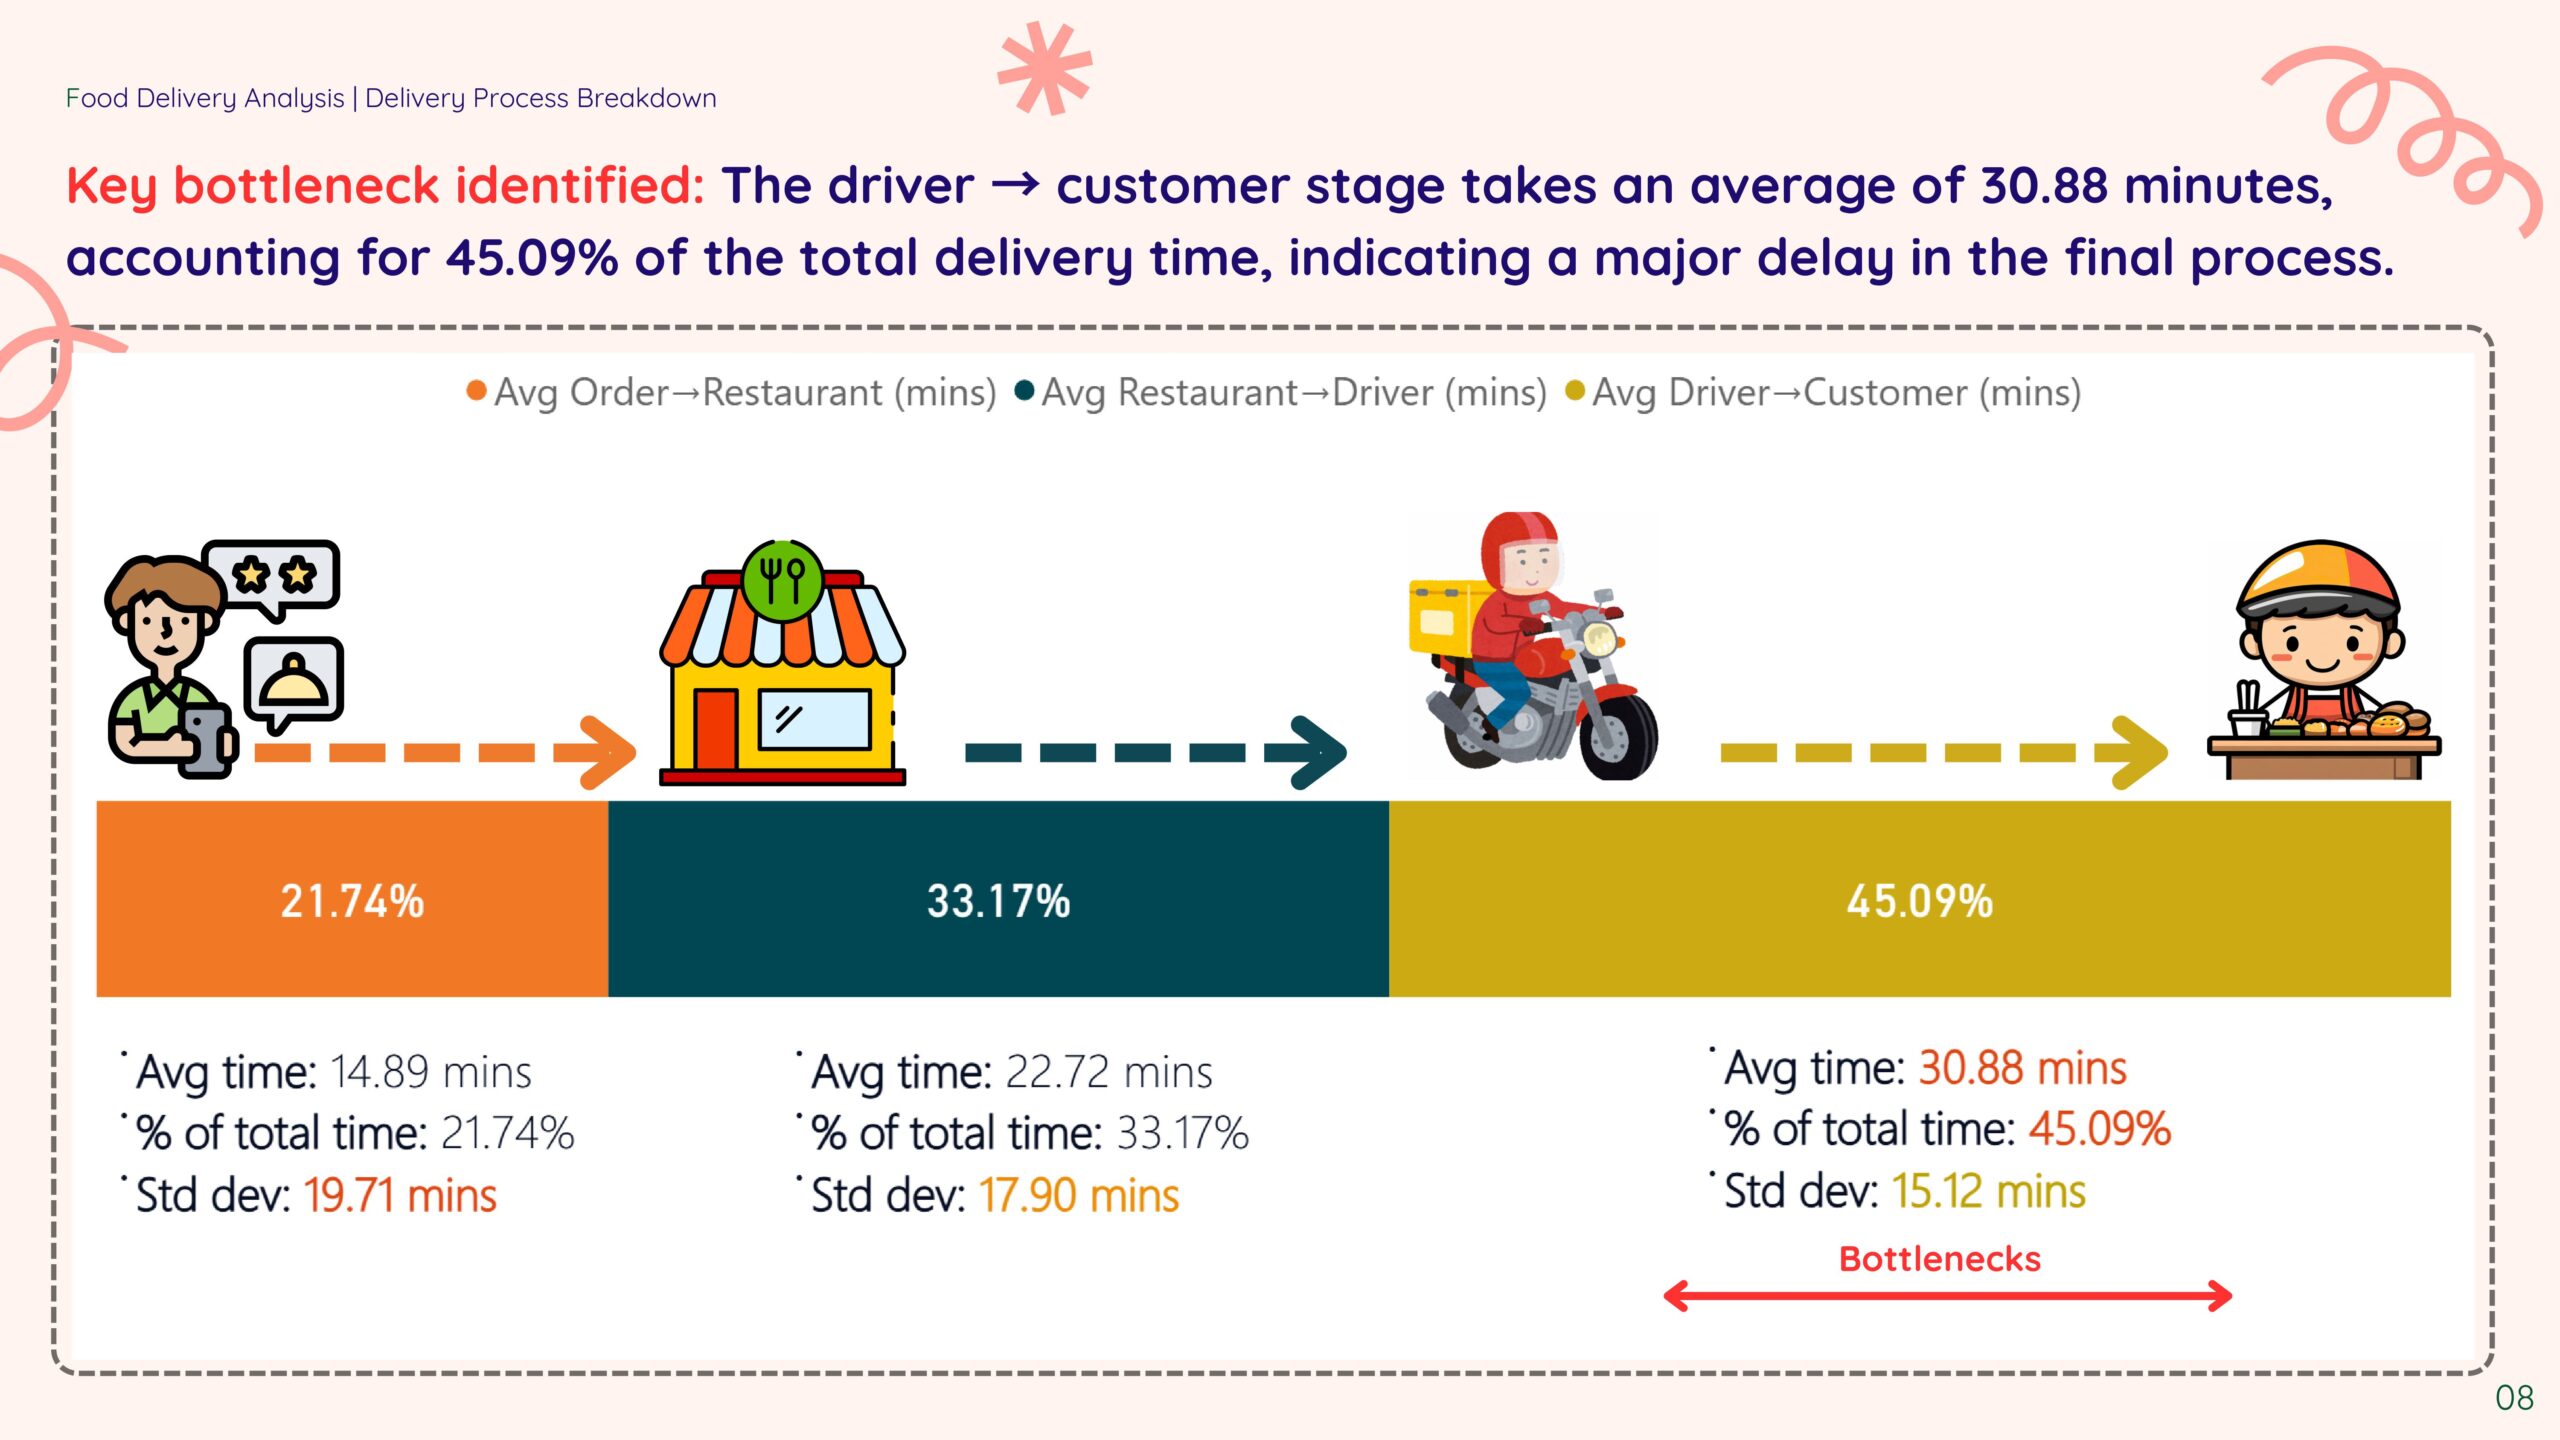
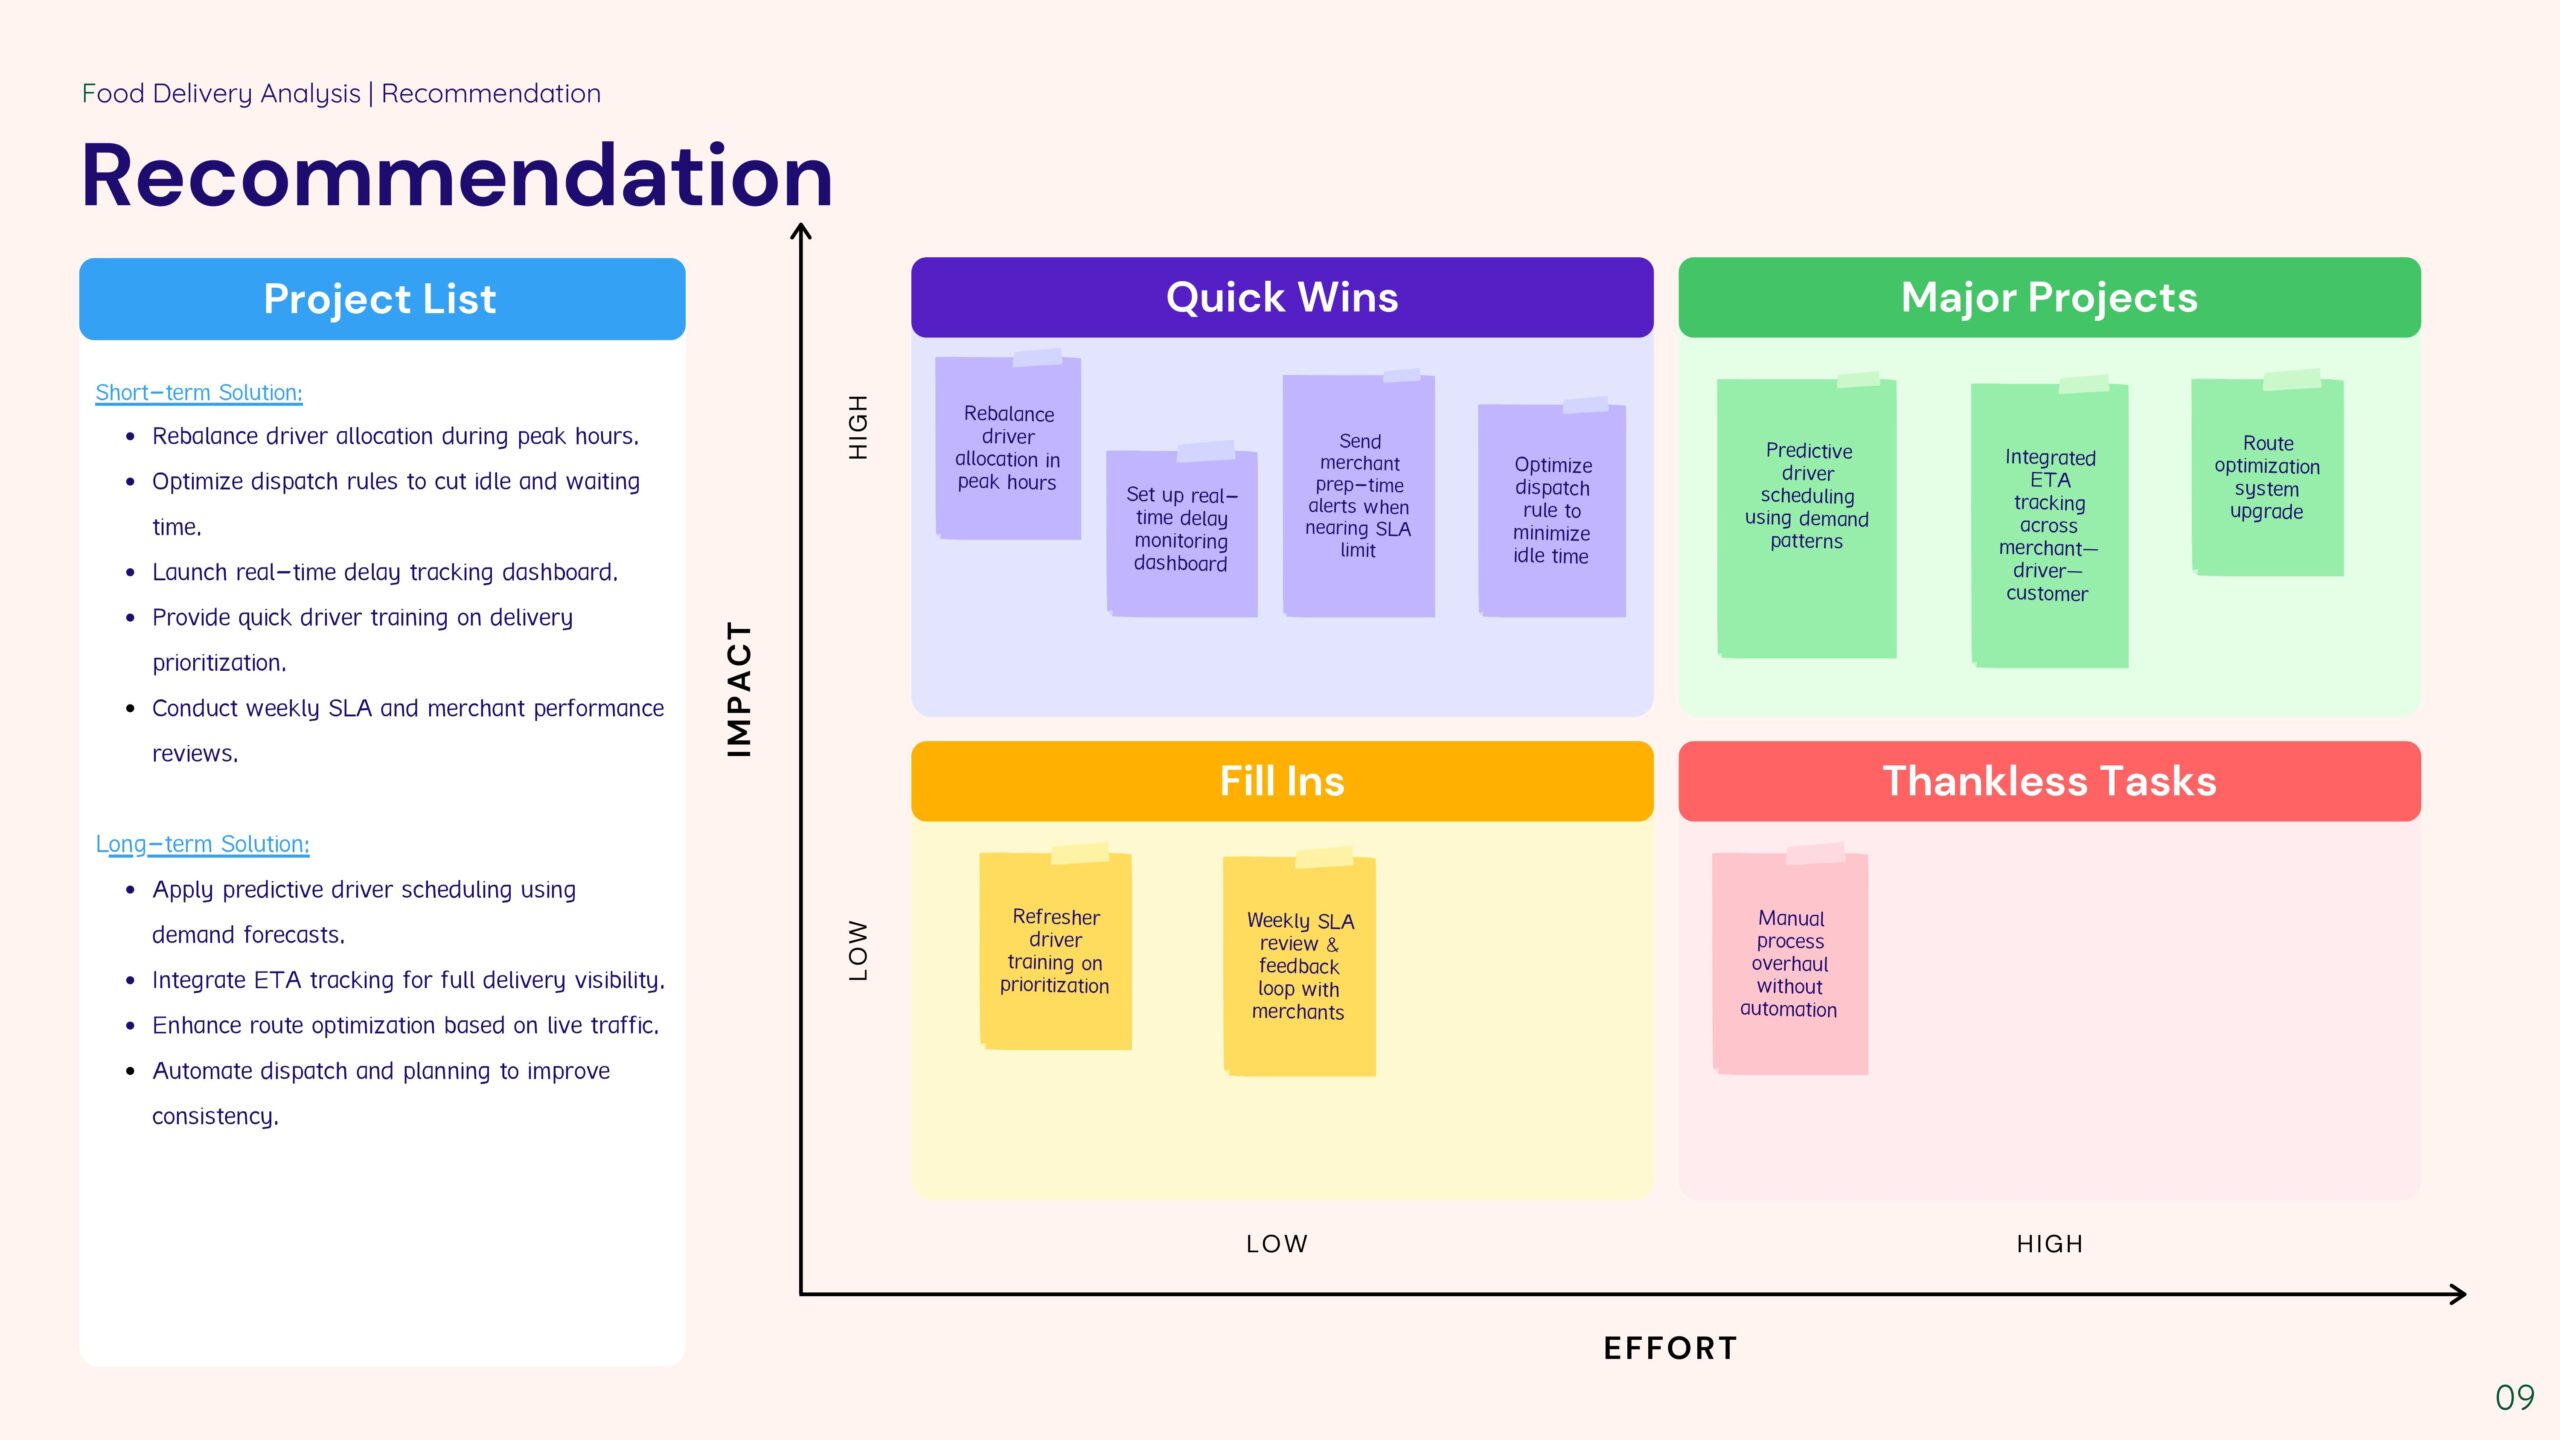
This project analyzes food delivery operations using January 2020 order data. Power BI was used to explore metrics such as delivery time, restaurant prep time, driver tips, revenue, and customer volume. The analysis identified performance patterns across drivers, restaurants, and delivery flows. Insights supported improvements in operational efficiency, customer satisfaction, and overall service quality.