
Chúc mừng bạn đã hoàn thành khóa học xuất sắc 🎉
Nâng tầm phân tích – Kết nối dữ liệu – Dẫn đầu quyết định
Khóa học "Master Analytical Thinking & Data Analysis with Power BI" tại MazHocData mang đến tư duy phân tích và kỹ năng Power BI thực chiến, sẵn sàng ứng dụng vào doanh nghiệp thực tế.
Financial Analytics Dashboard
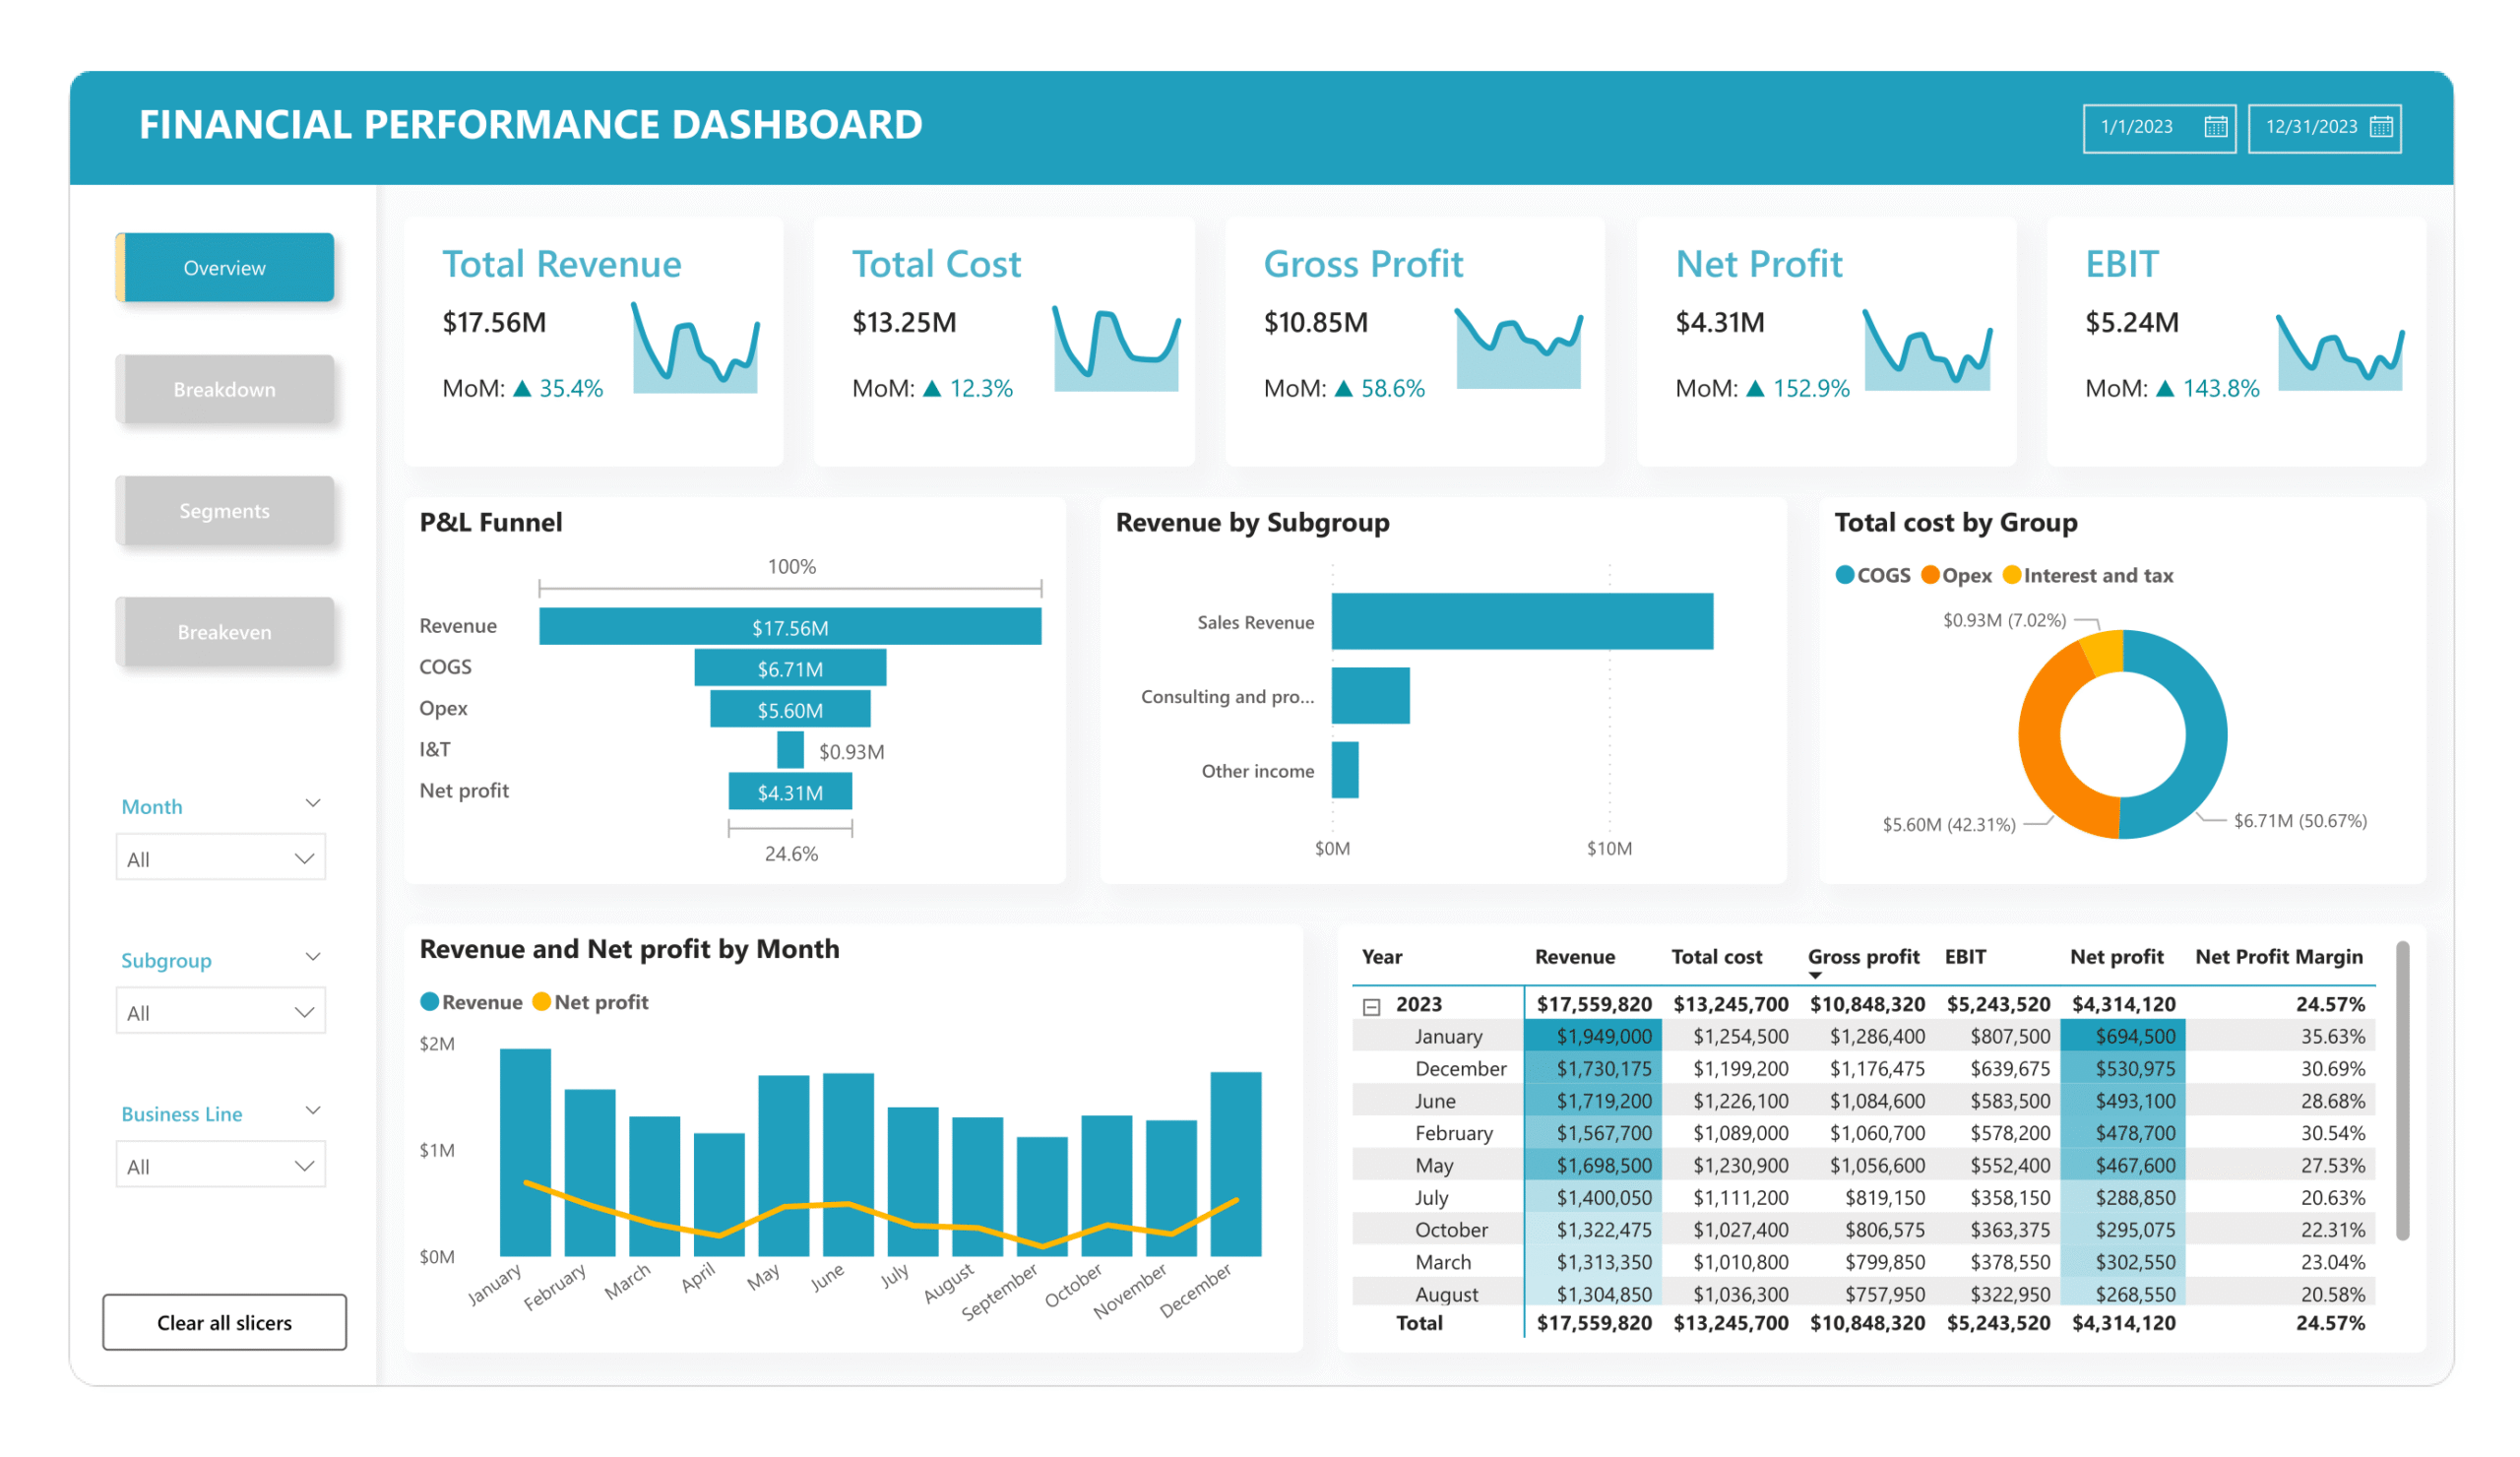
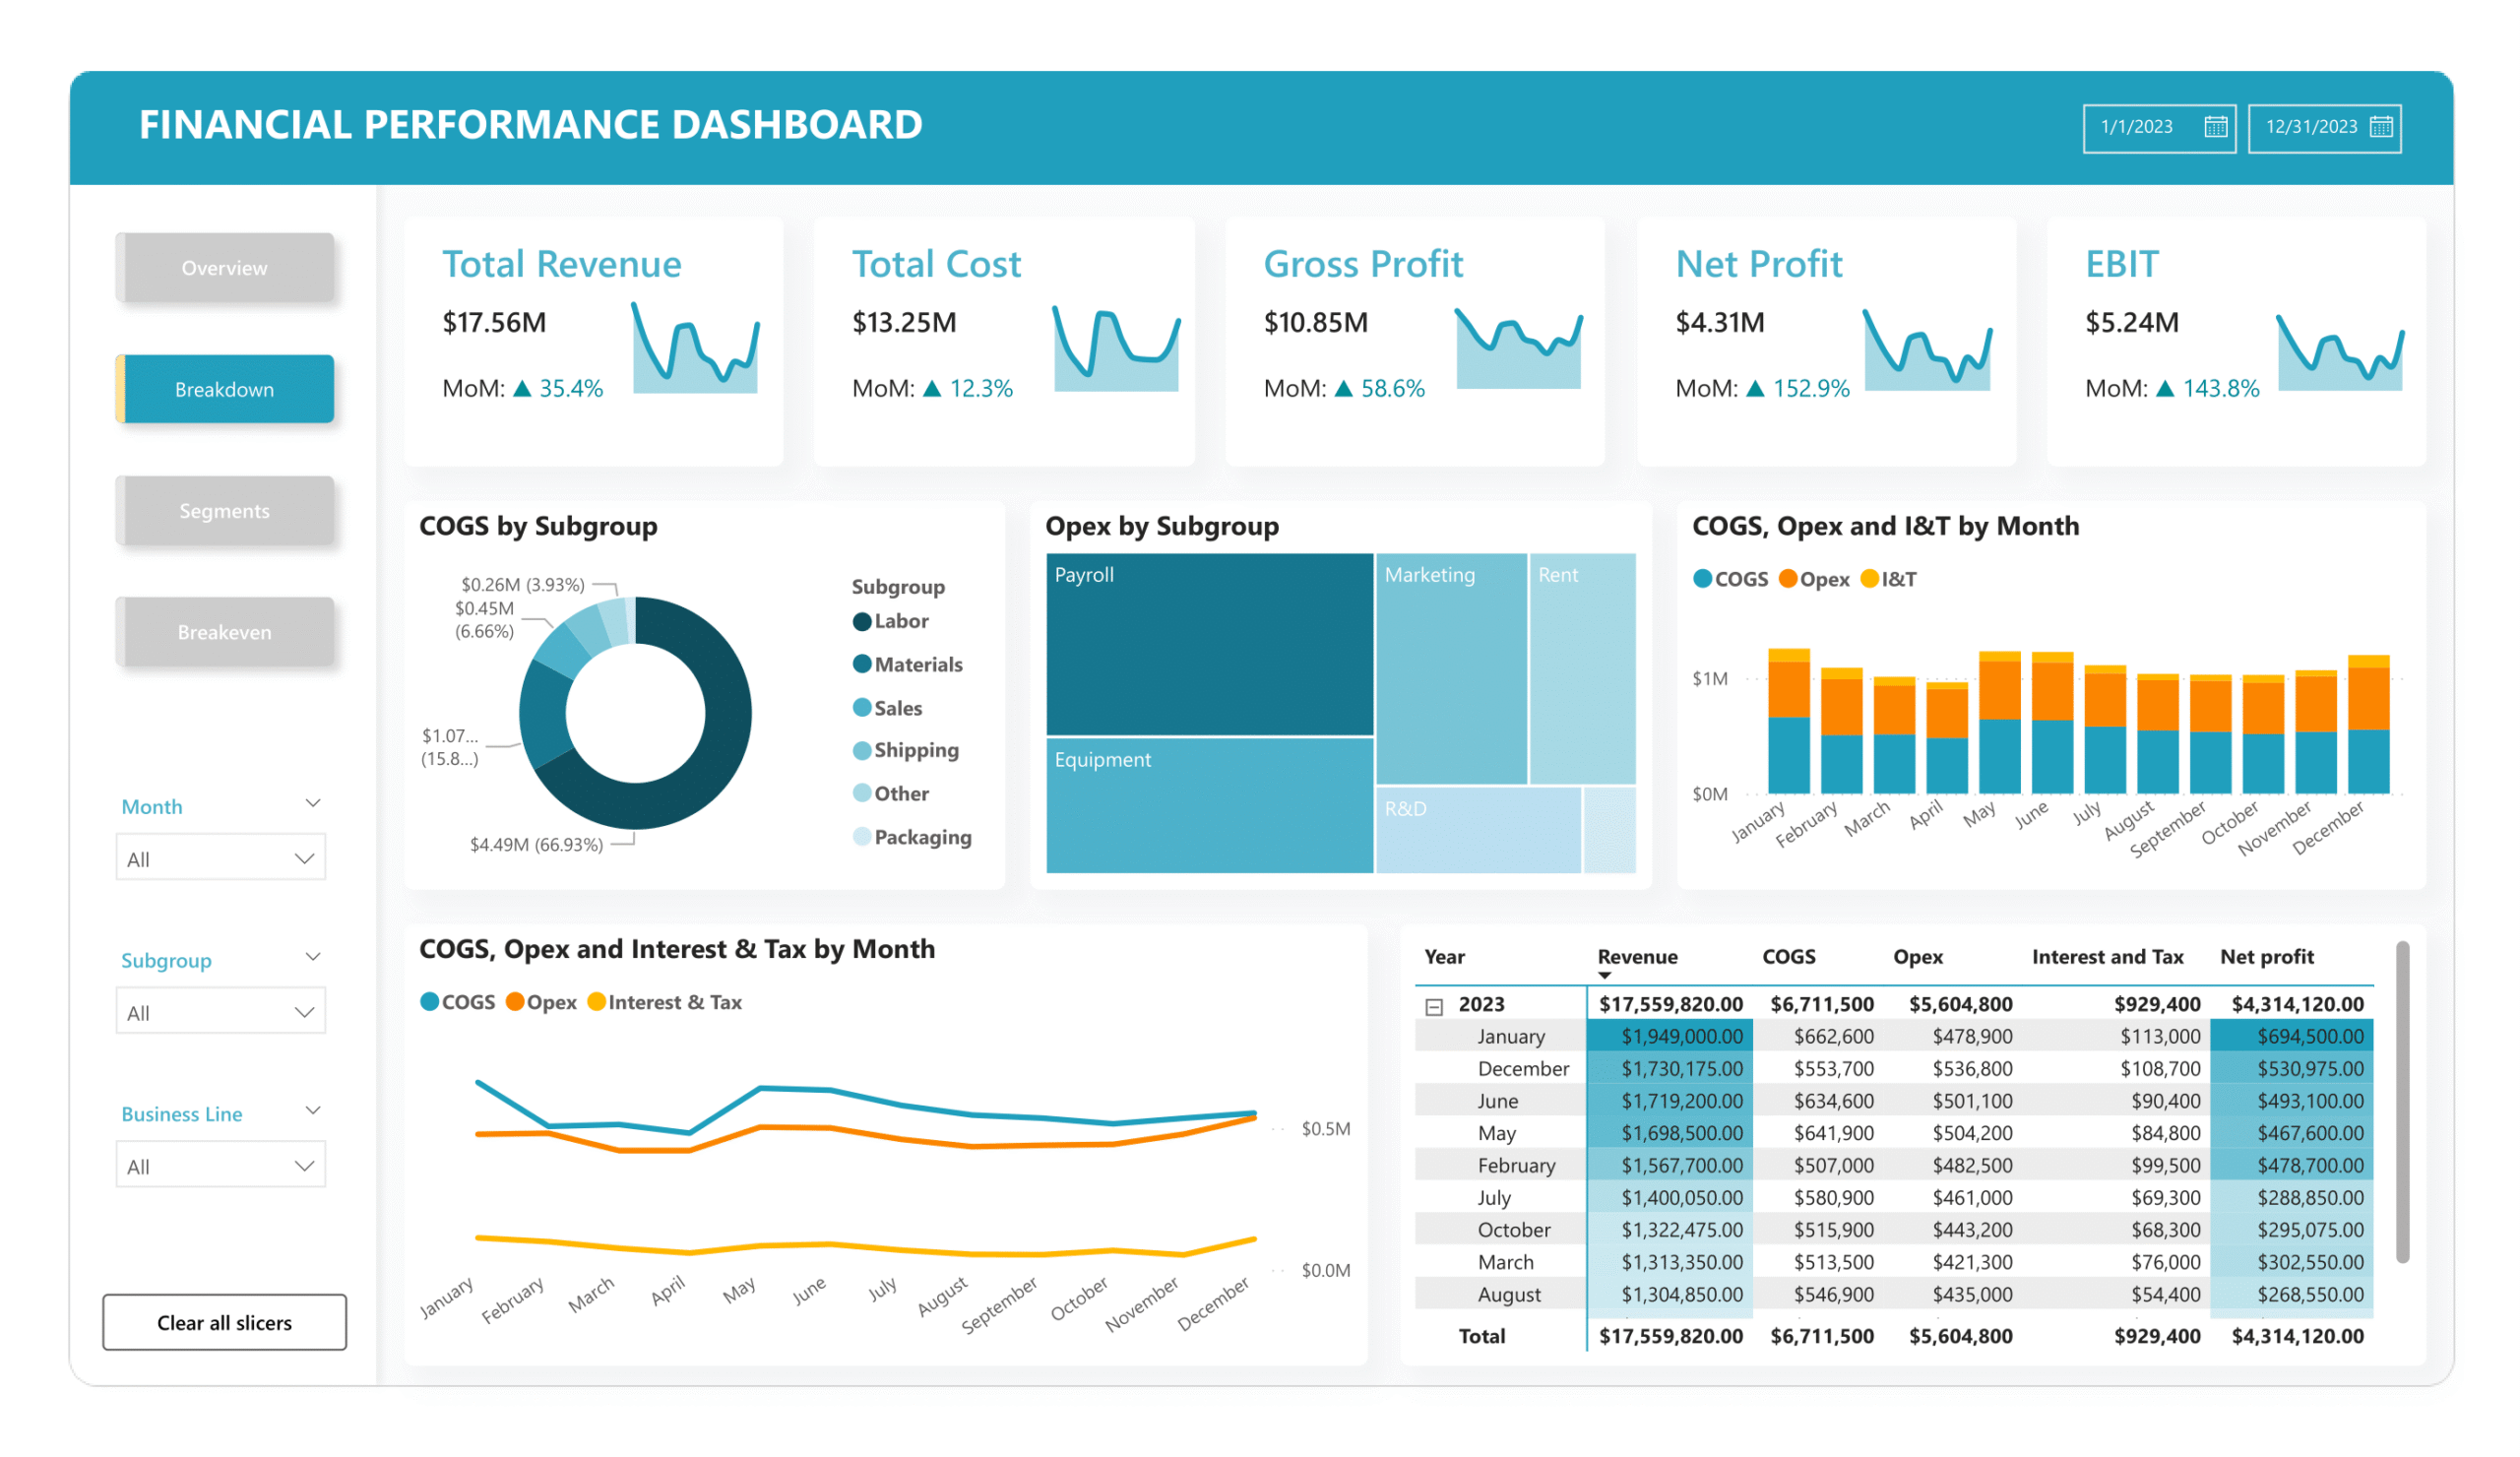
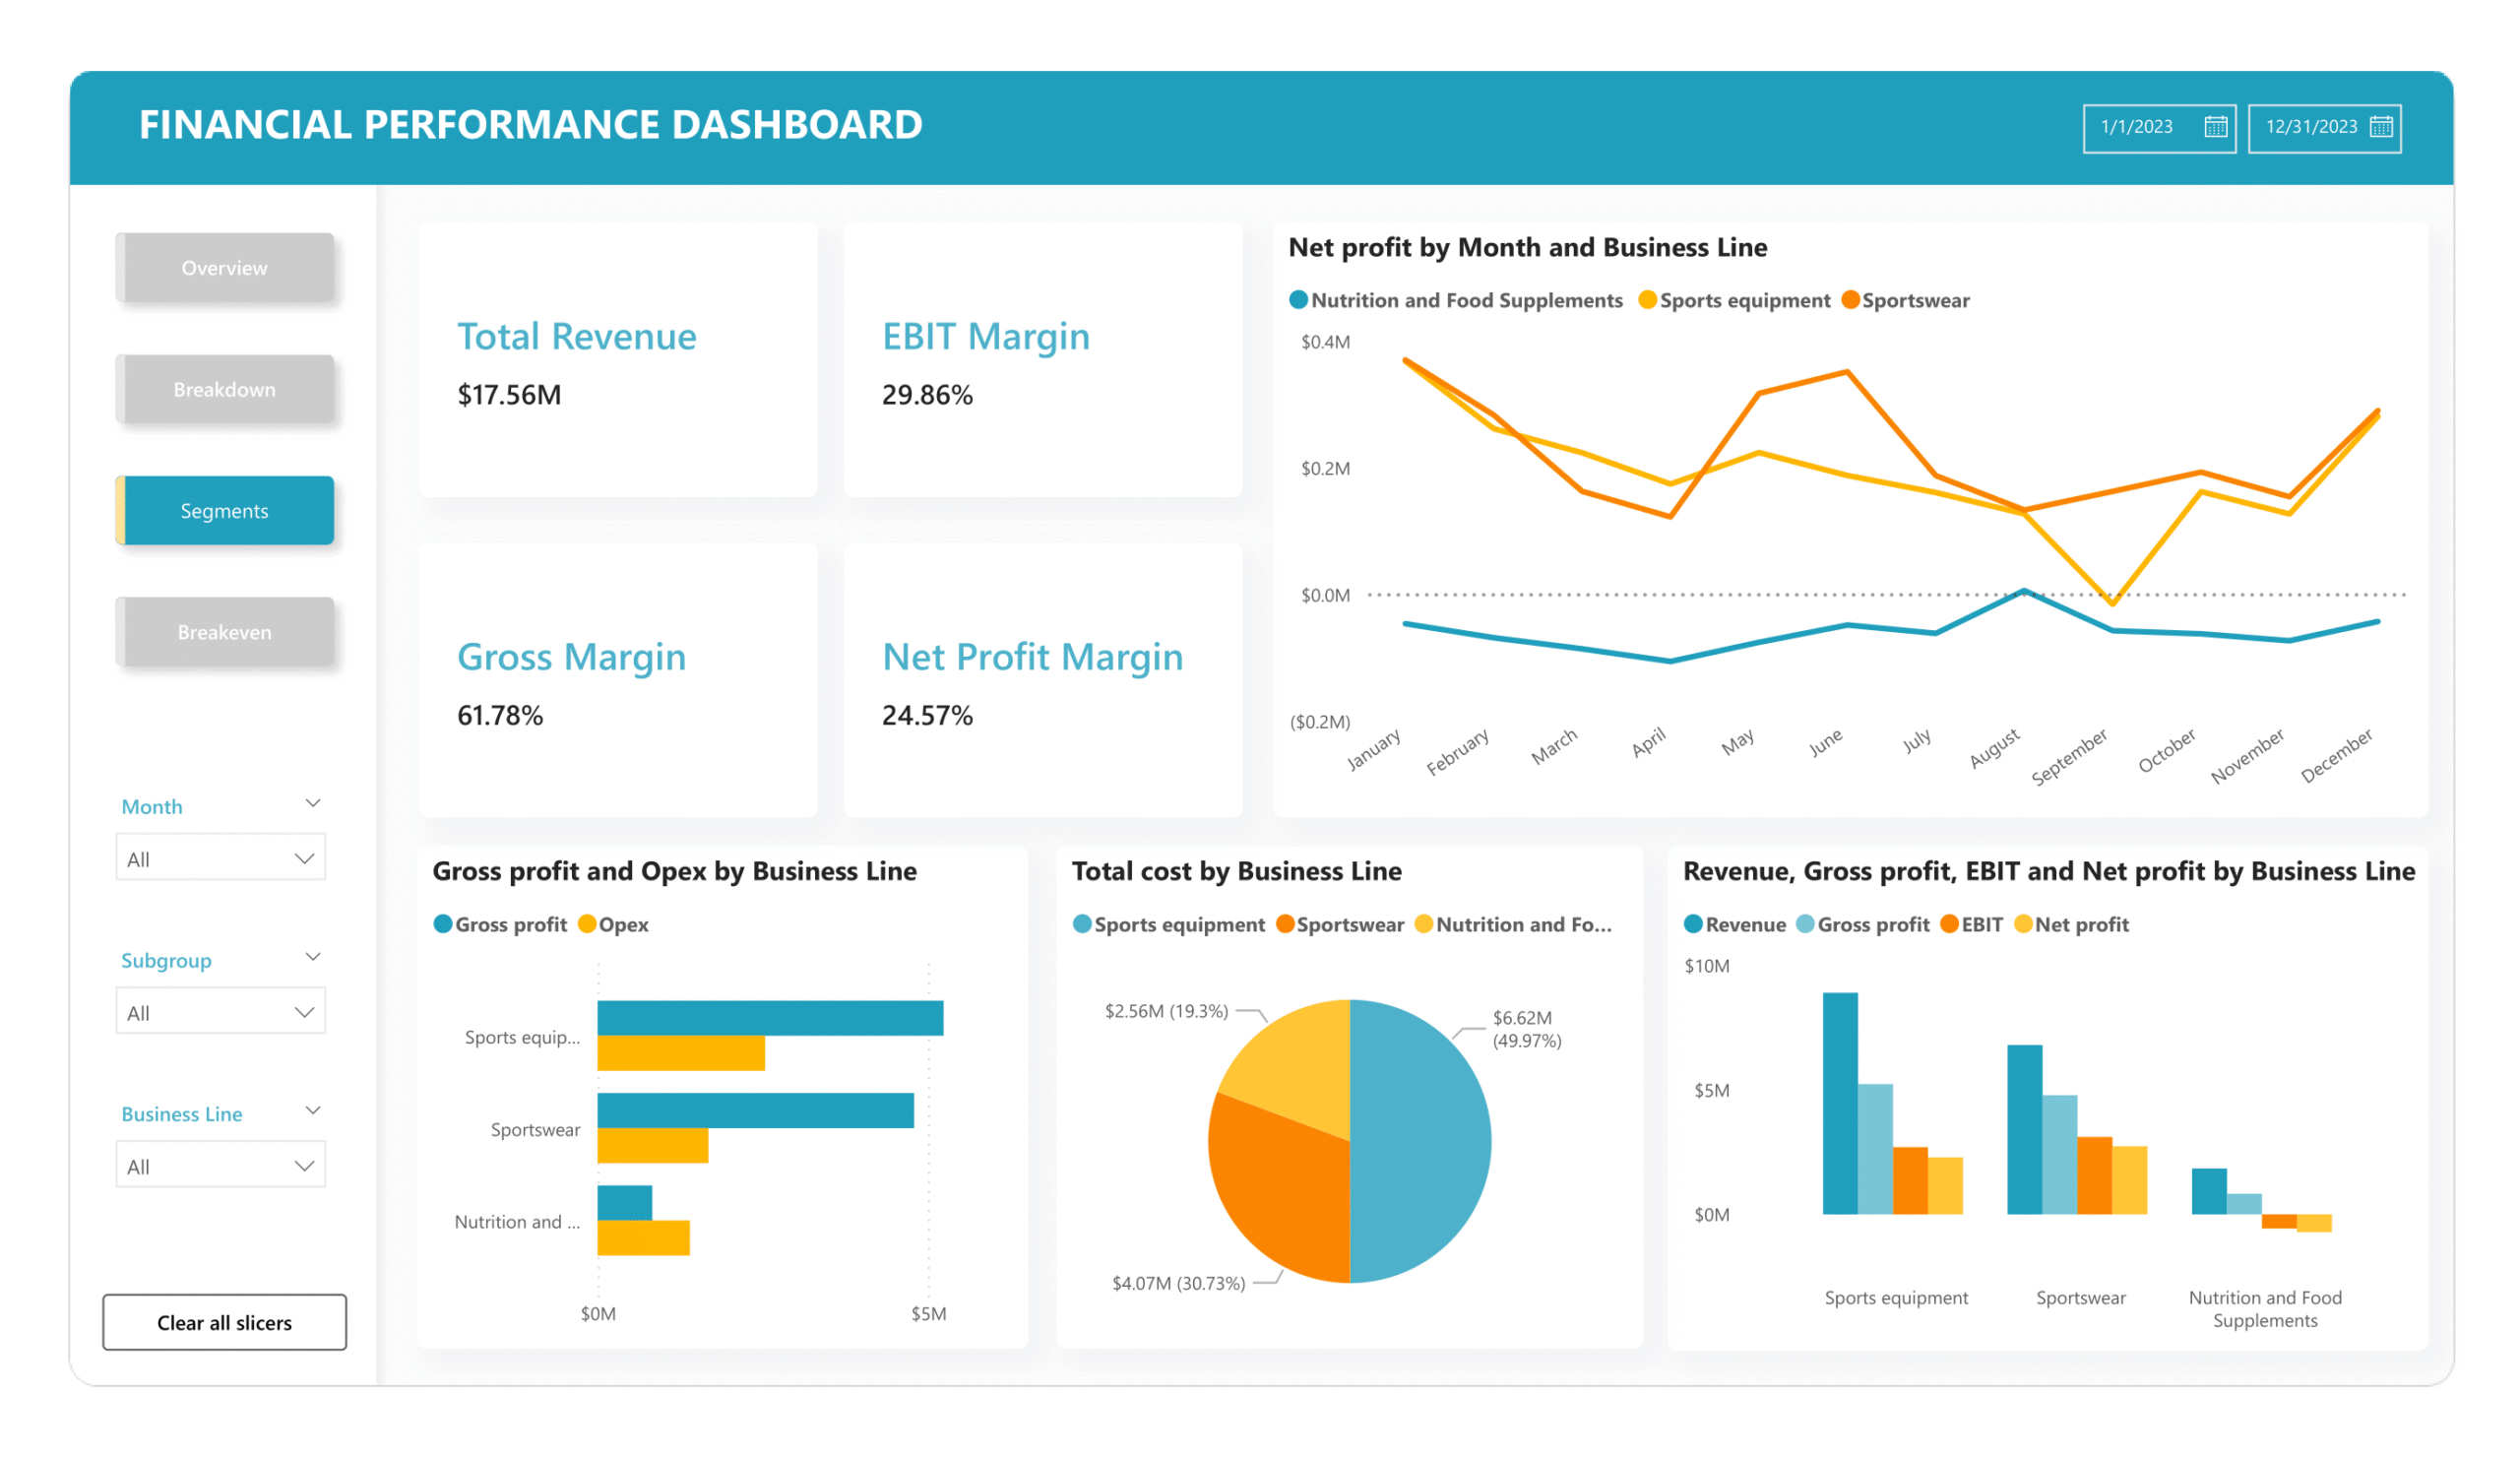
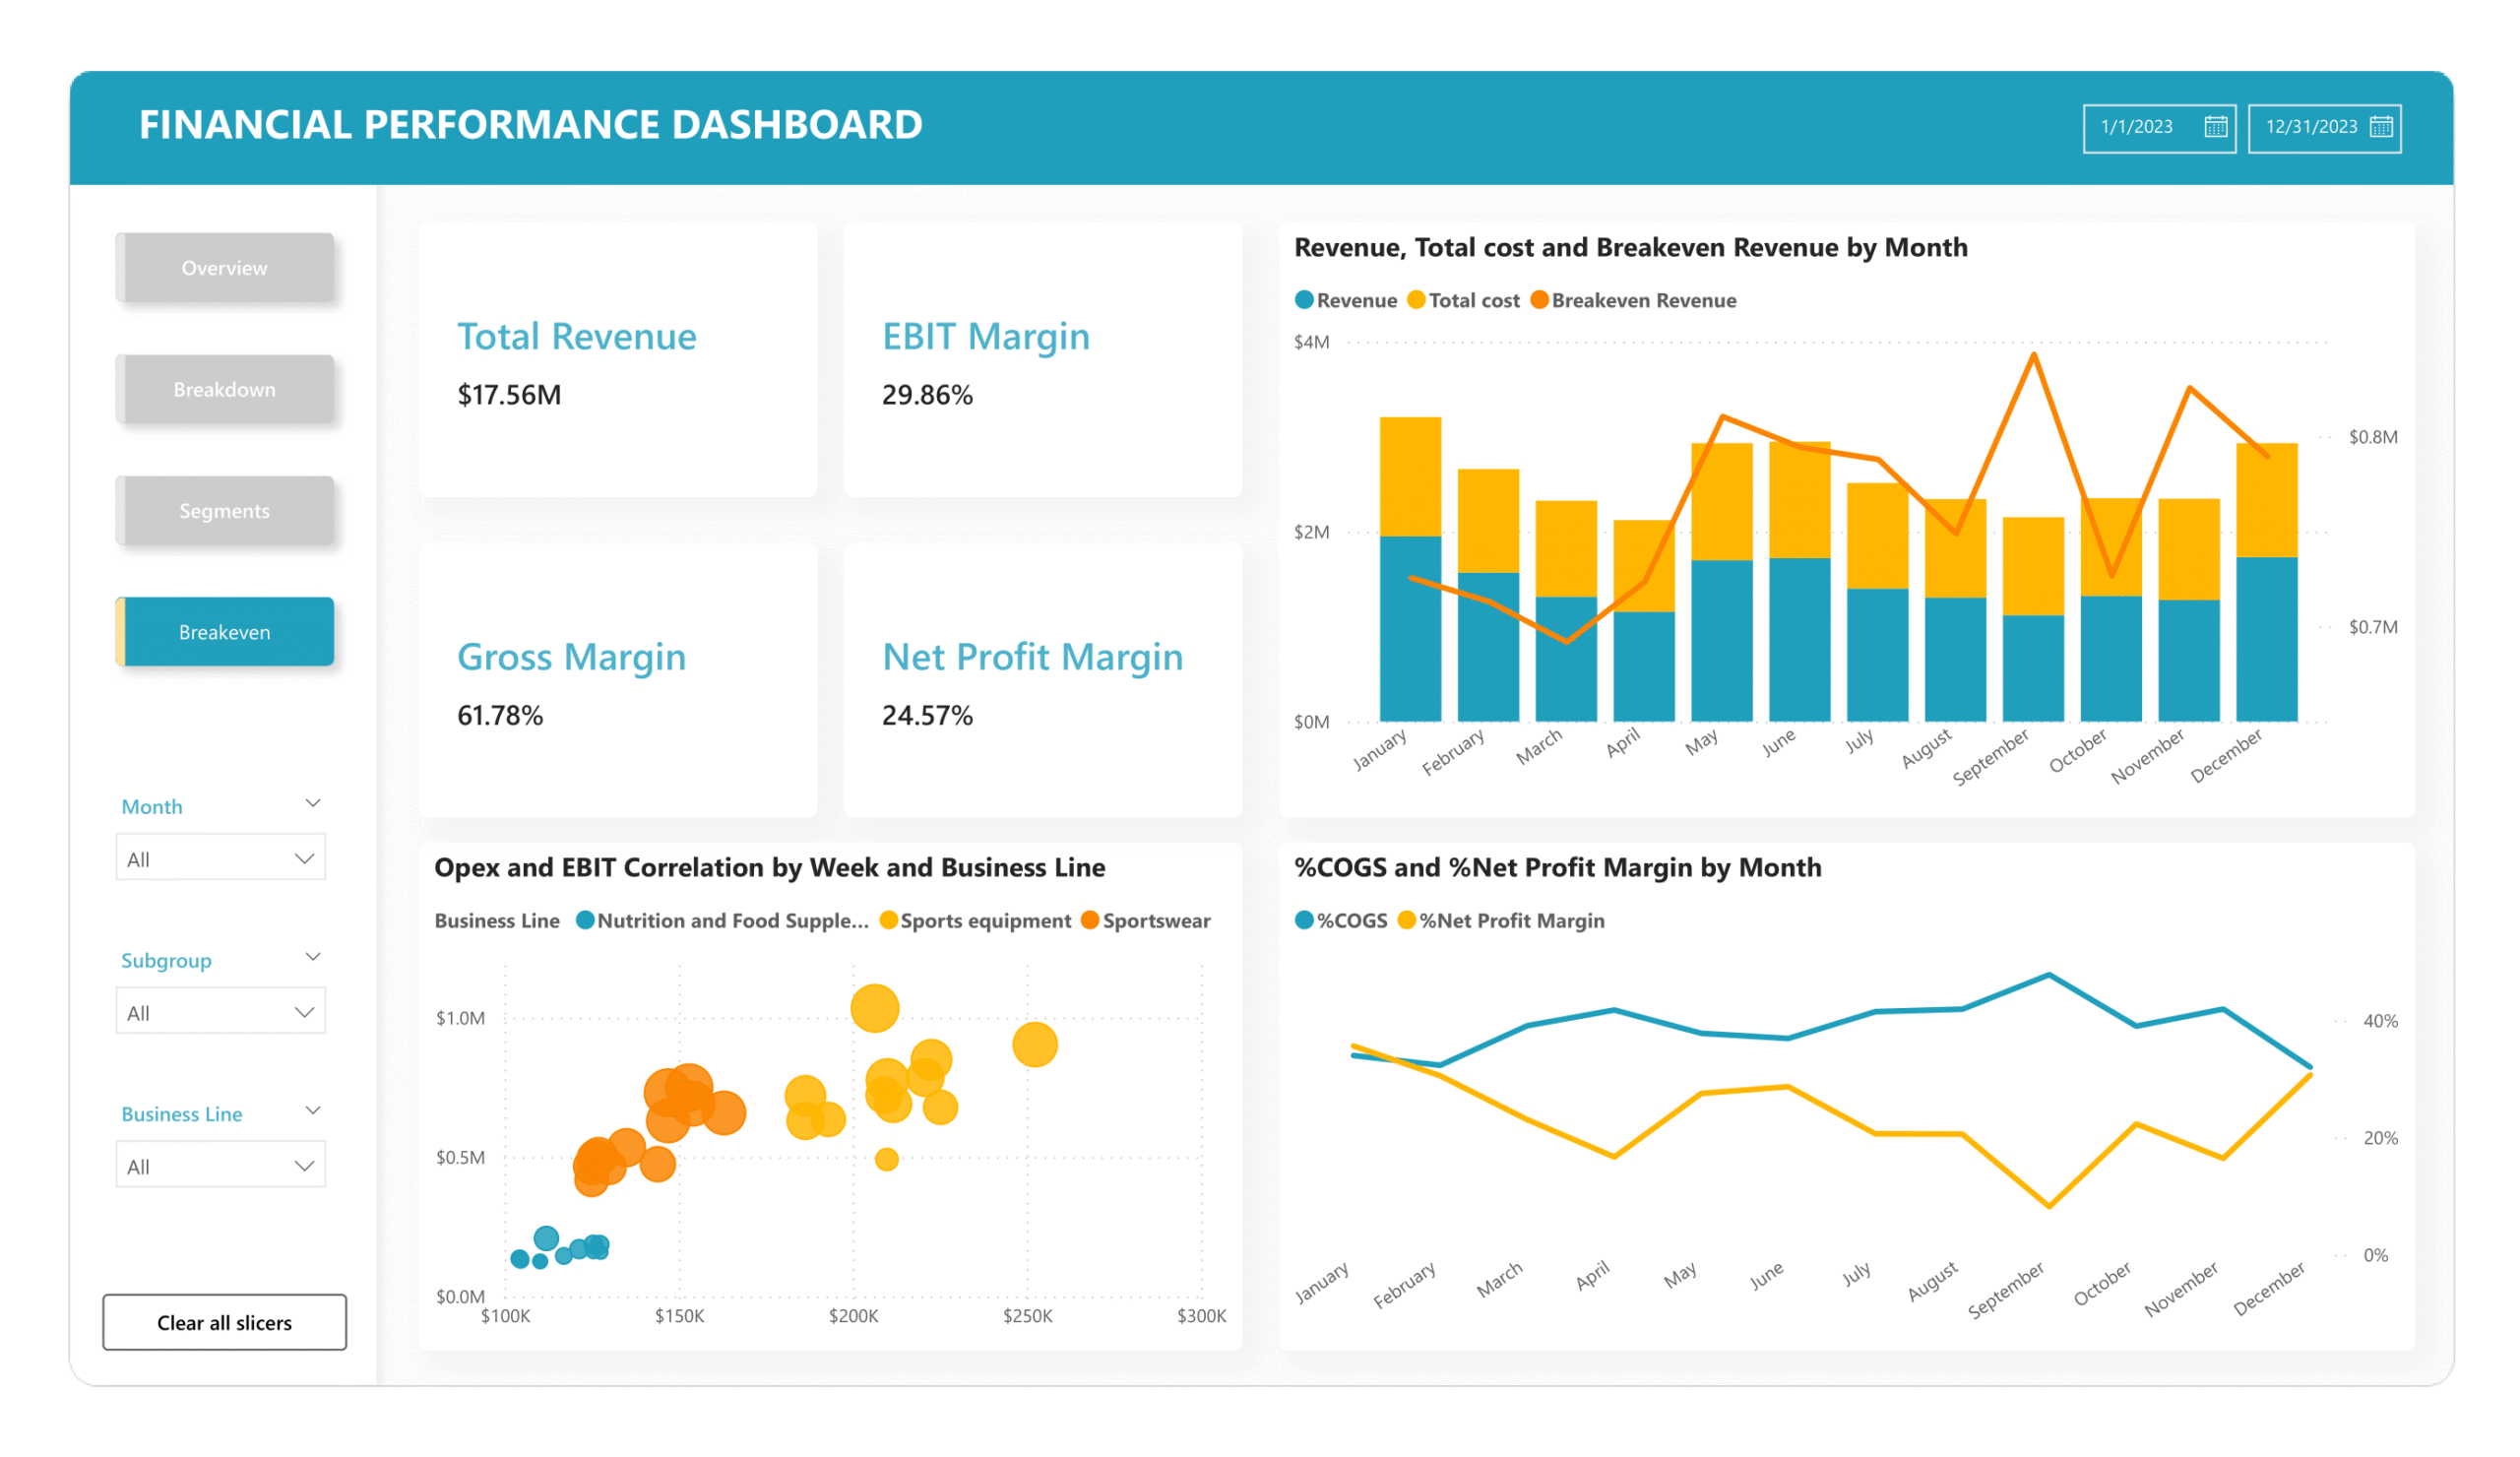
The Financial Analytics dataset models a multi-line sports & wellness company's 2023 P&L with 580 transactions in a star schema. It captures revenue, COGS components, Opex categories, and monthly totals to enable product-level and temporal profitability analysis. Learners can examine margins by product line, decompose COGS and Opex drivers, assess break-even and seasonality, benchmark financial performance, and identify cost-structure levers to improve gross and net profit margins across Sports Equipment, Sportswear, and Nutrition.
Skills Applied
Credit Risk Analysis

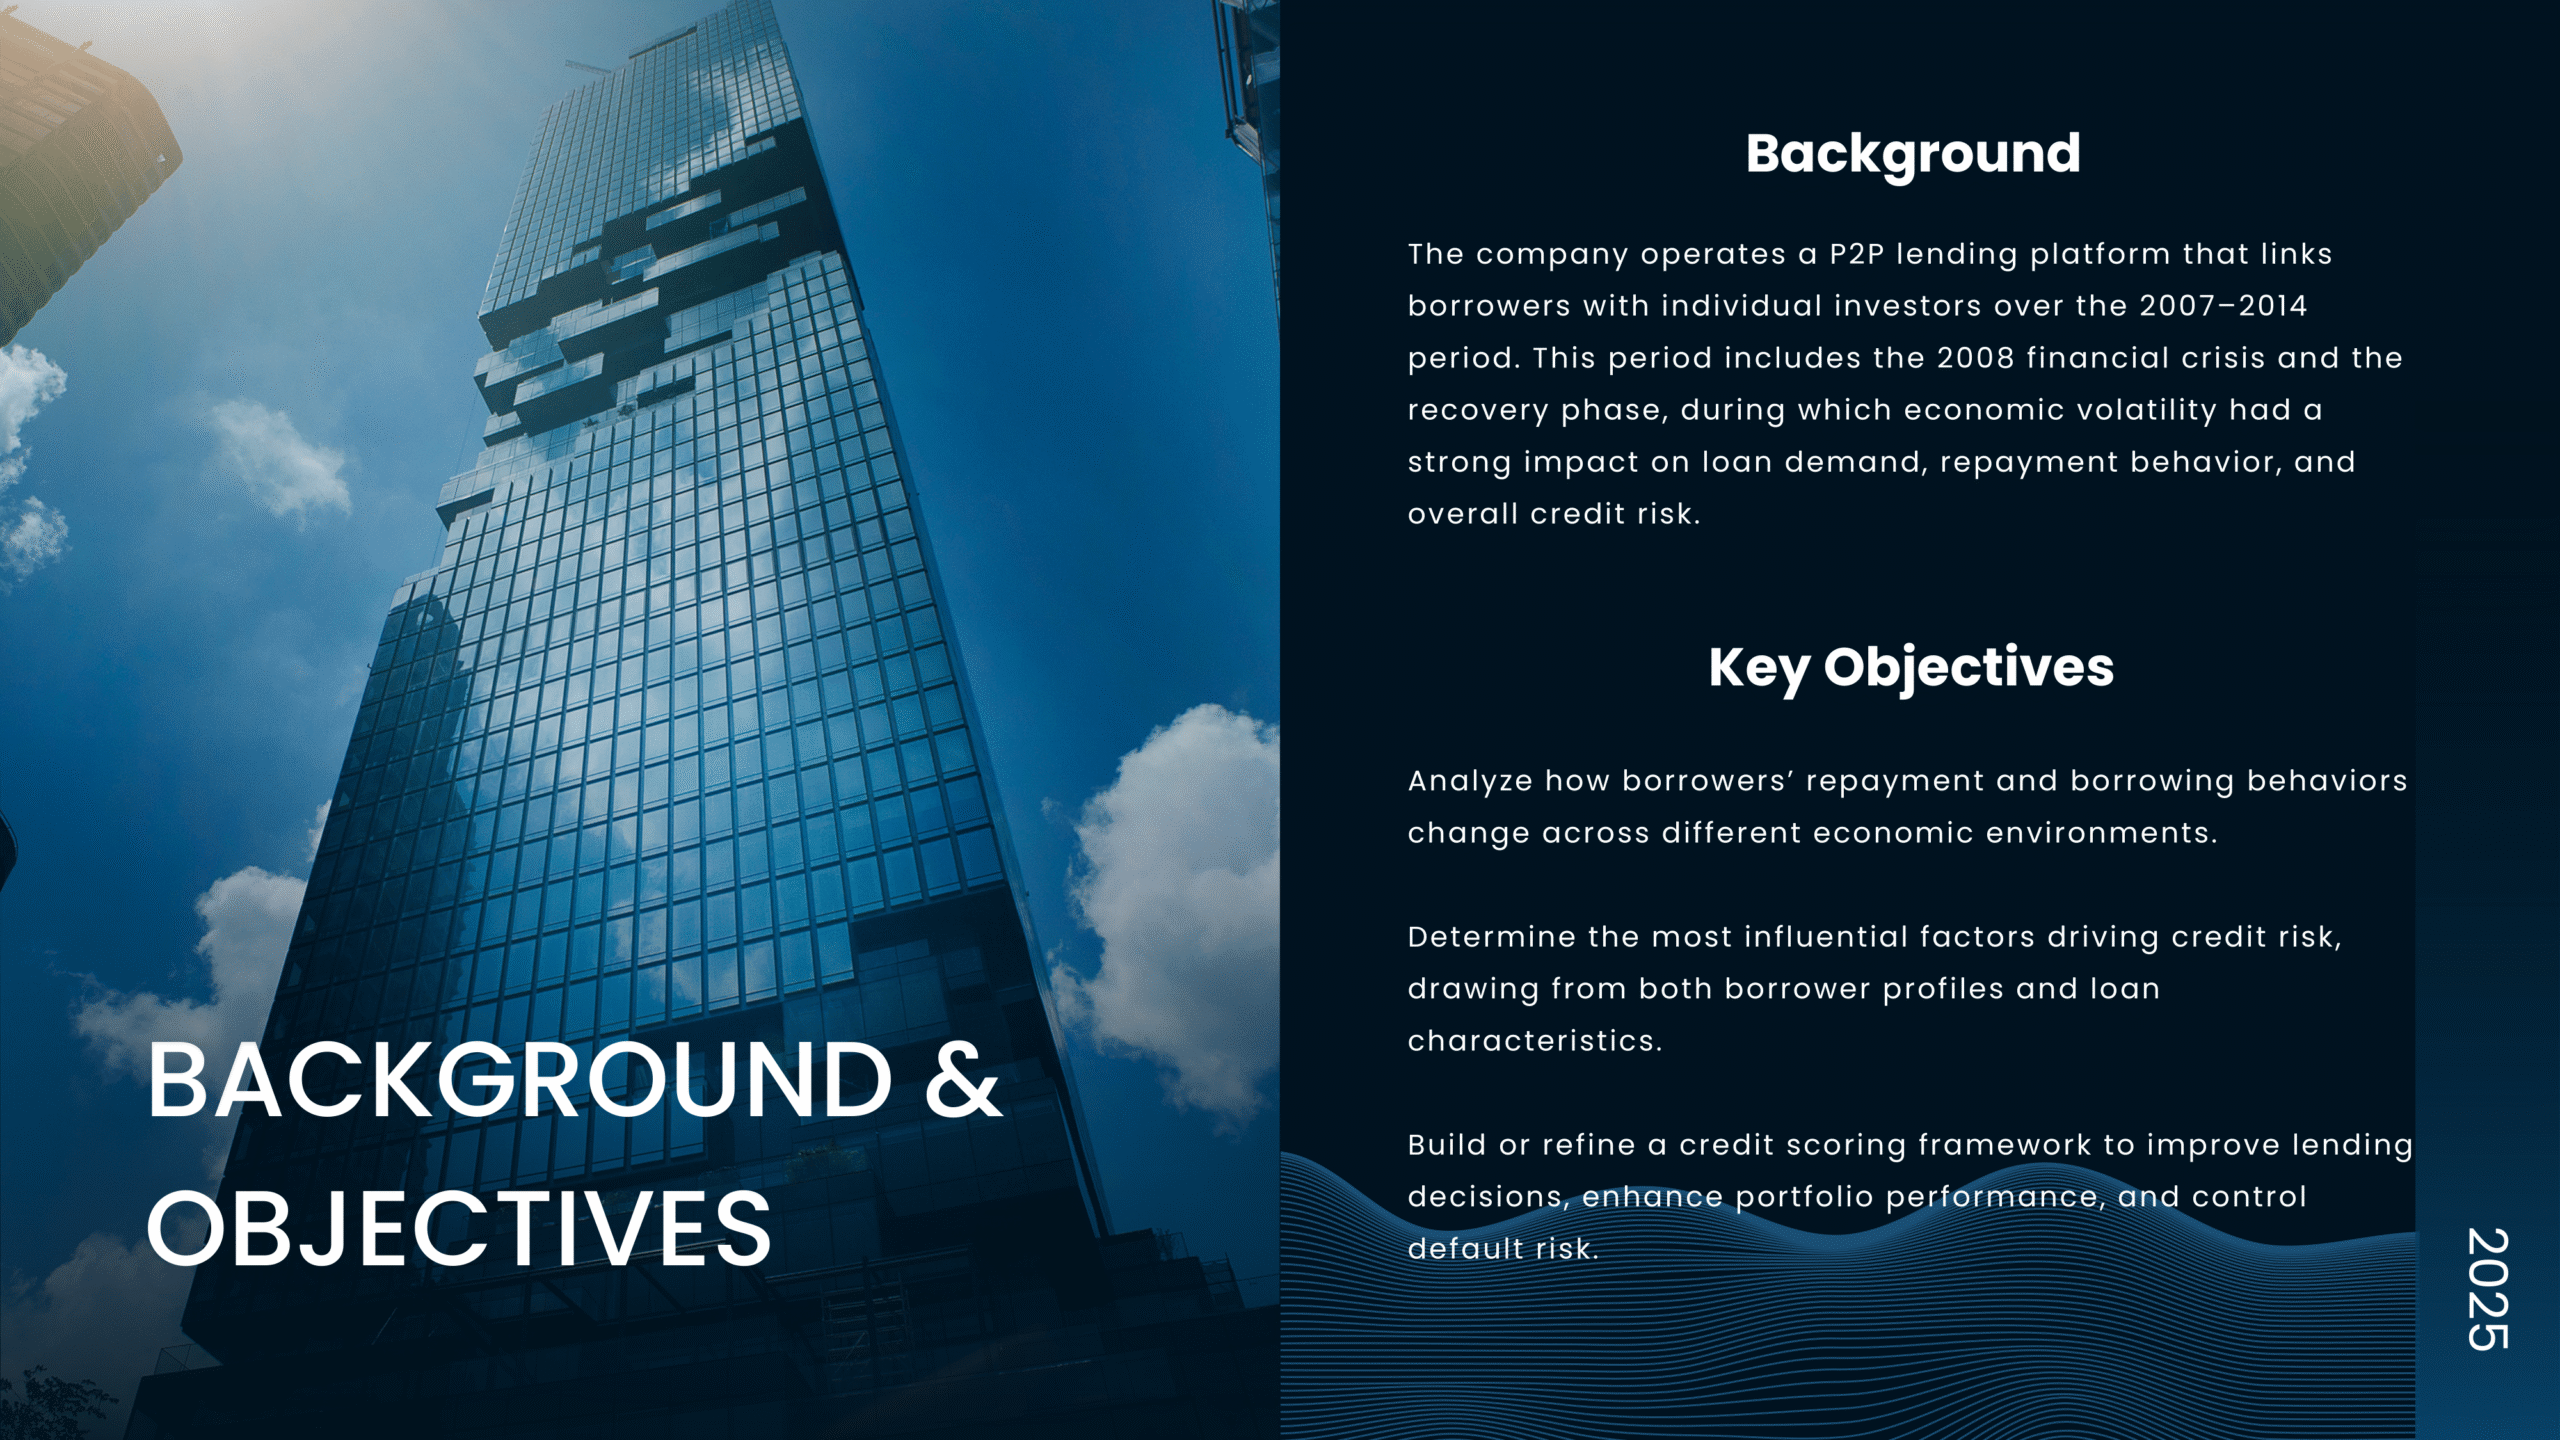
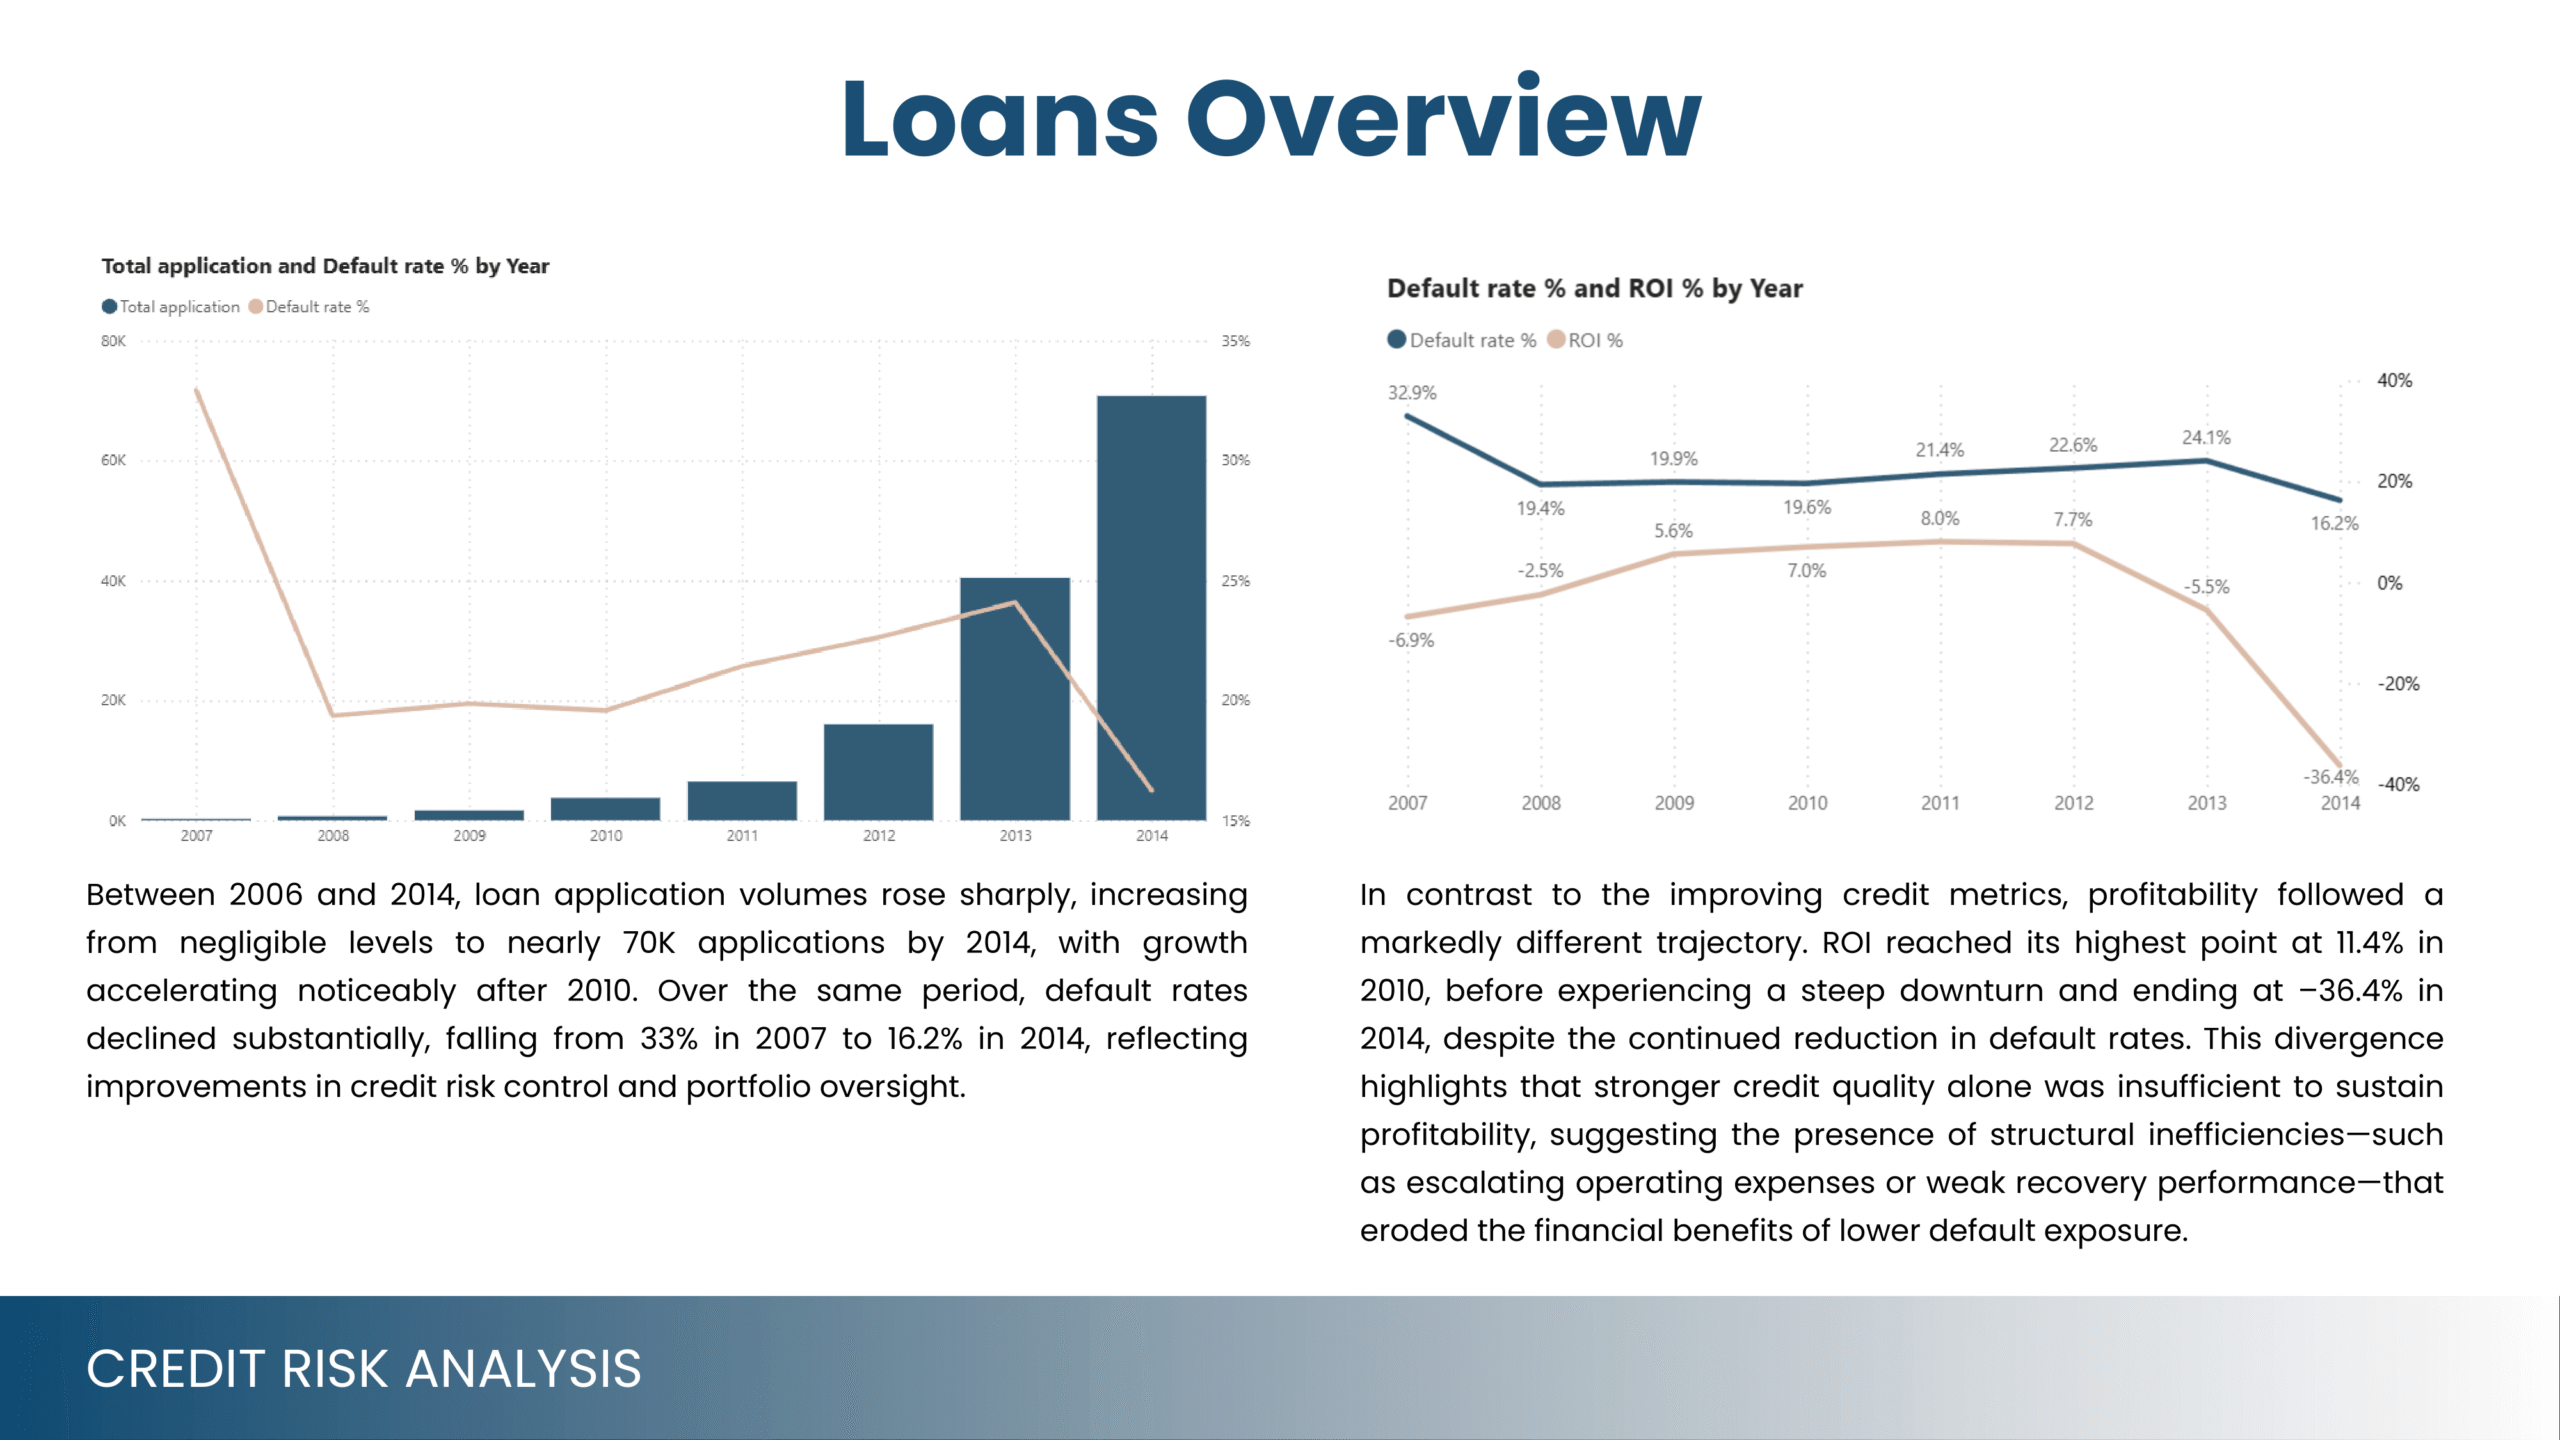
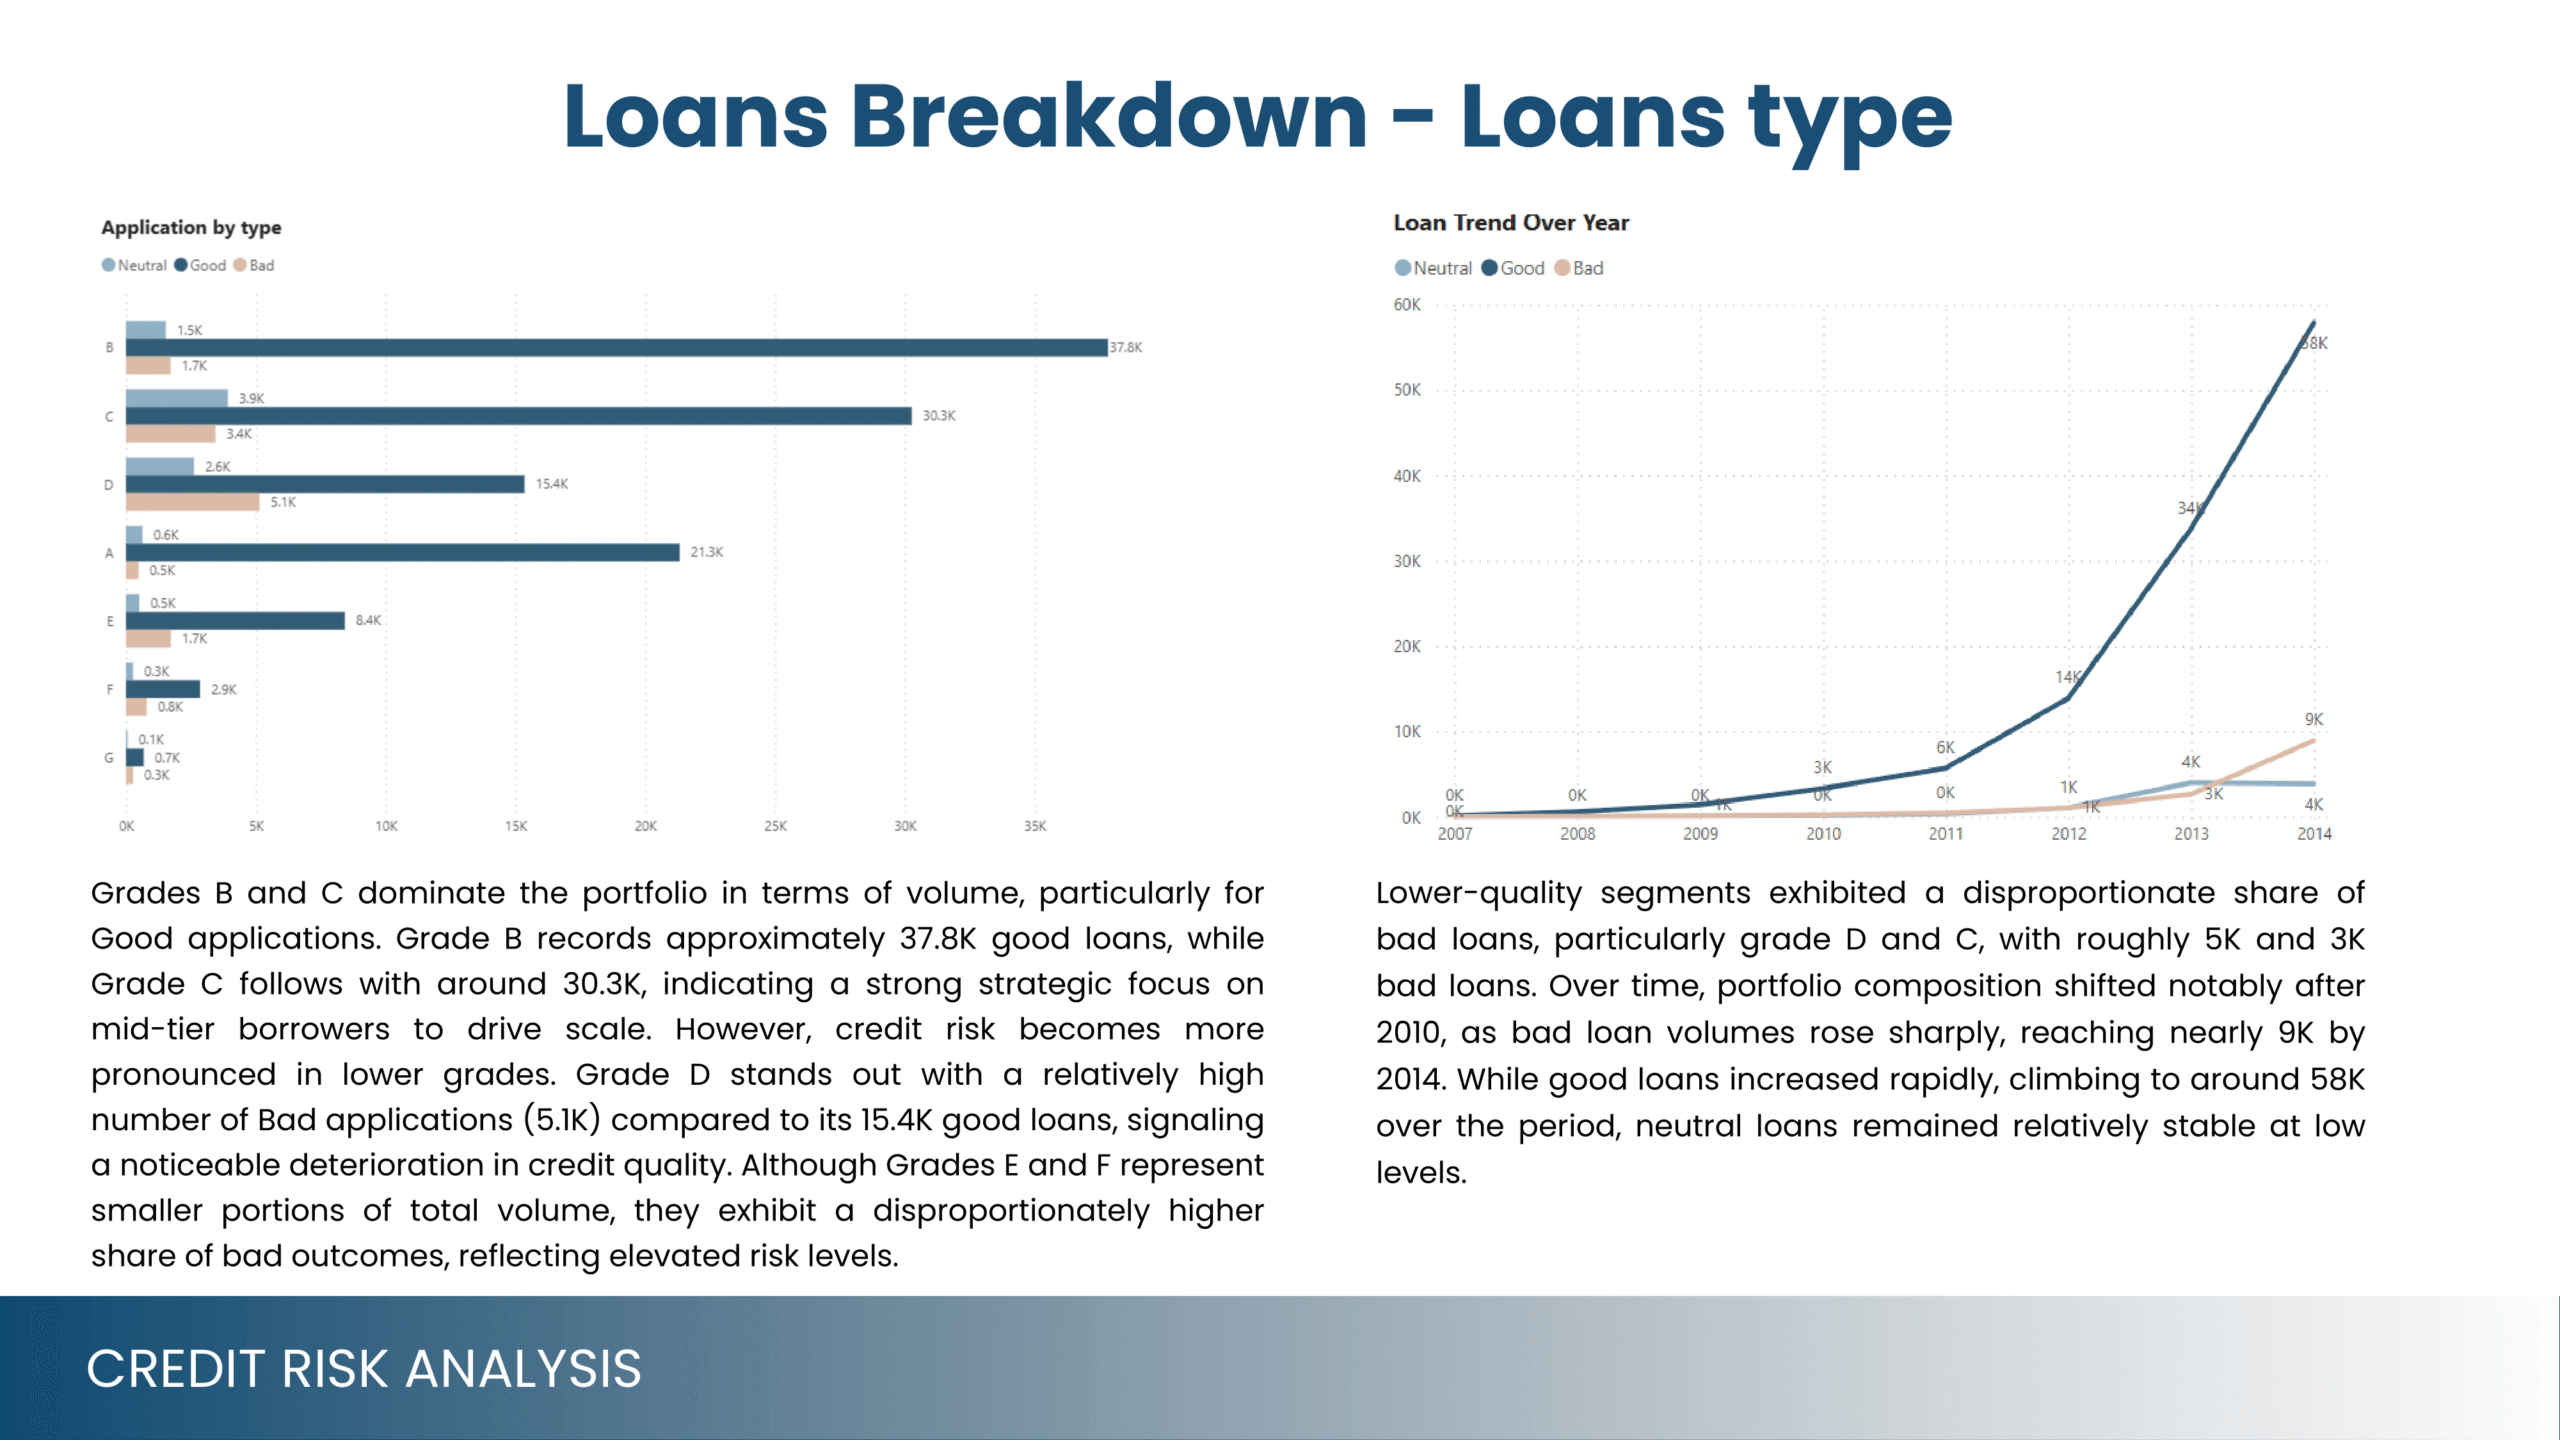
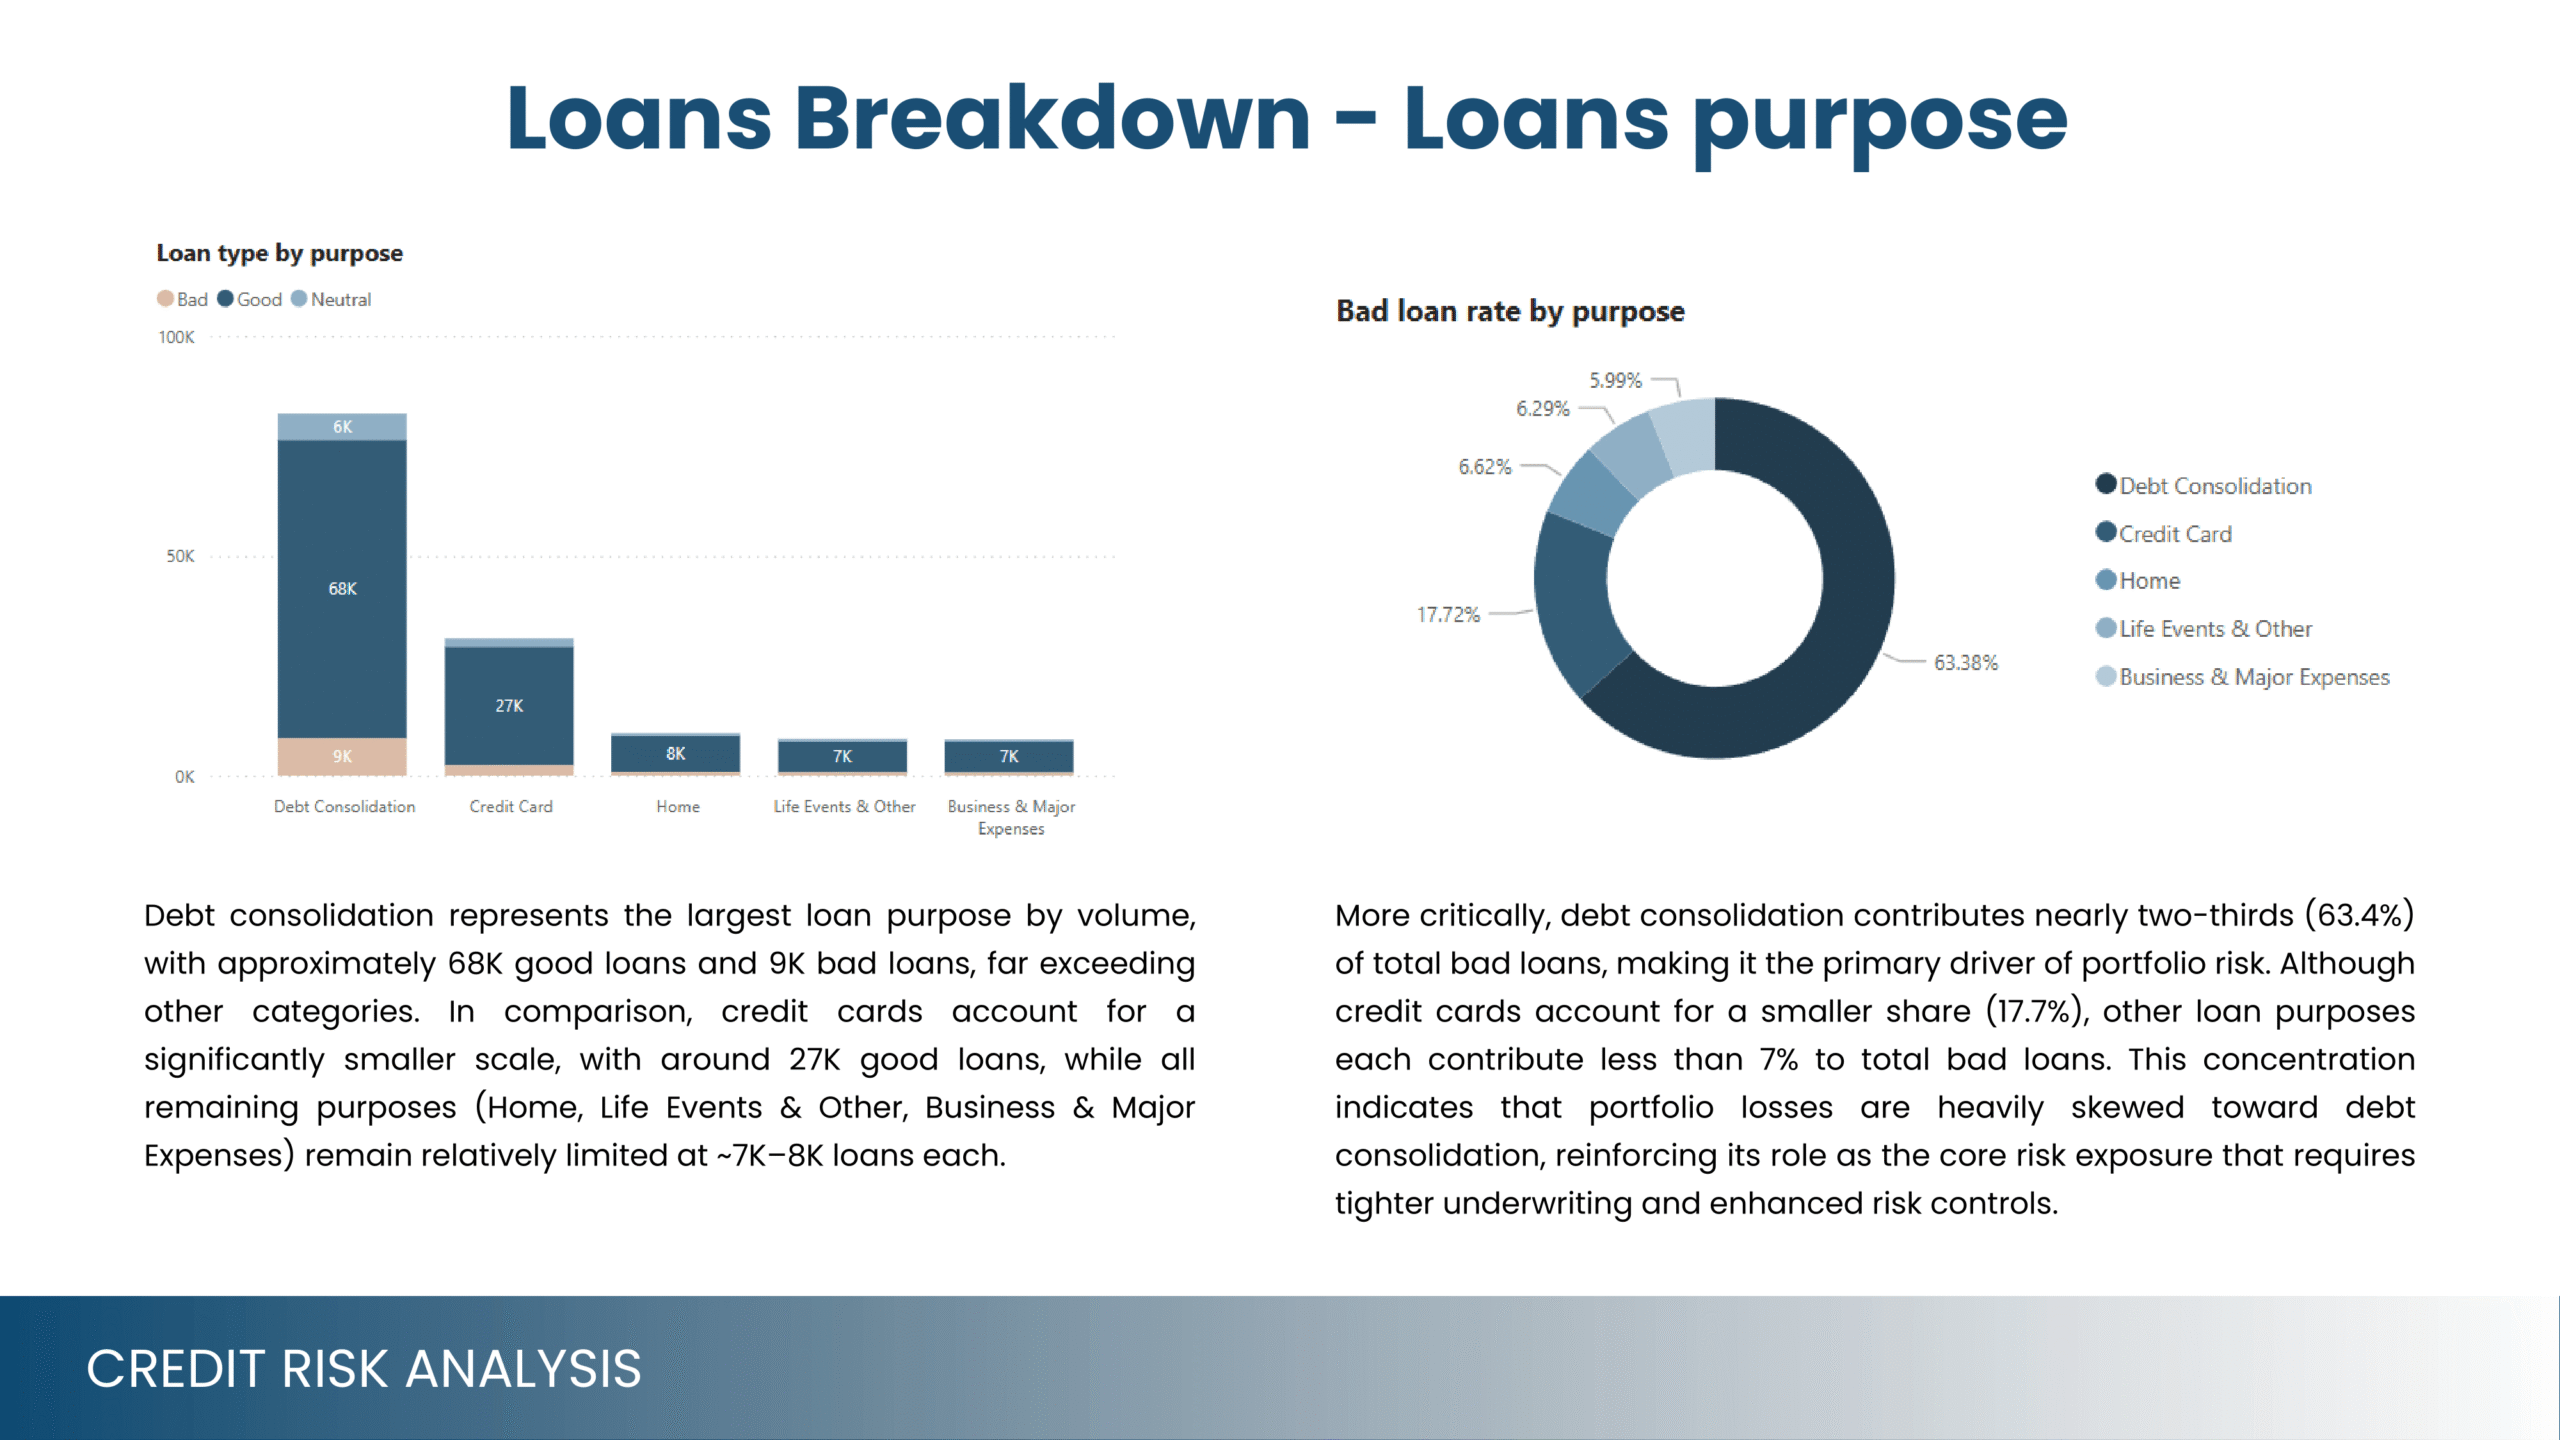
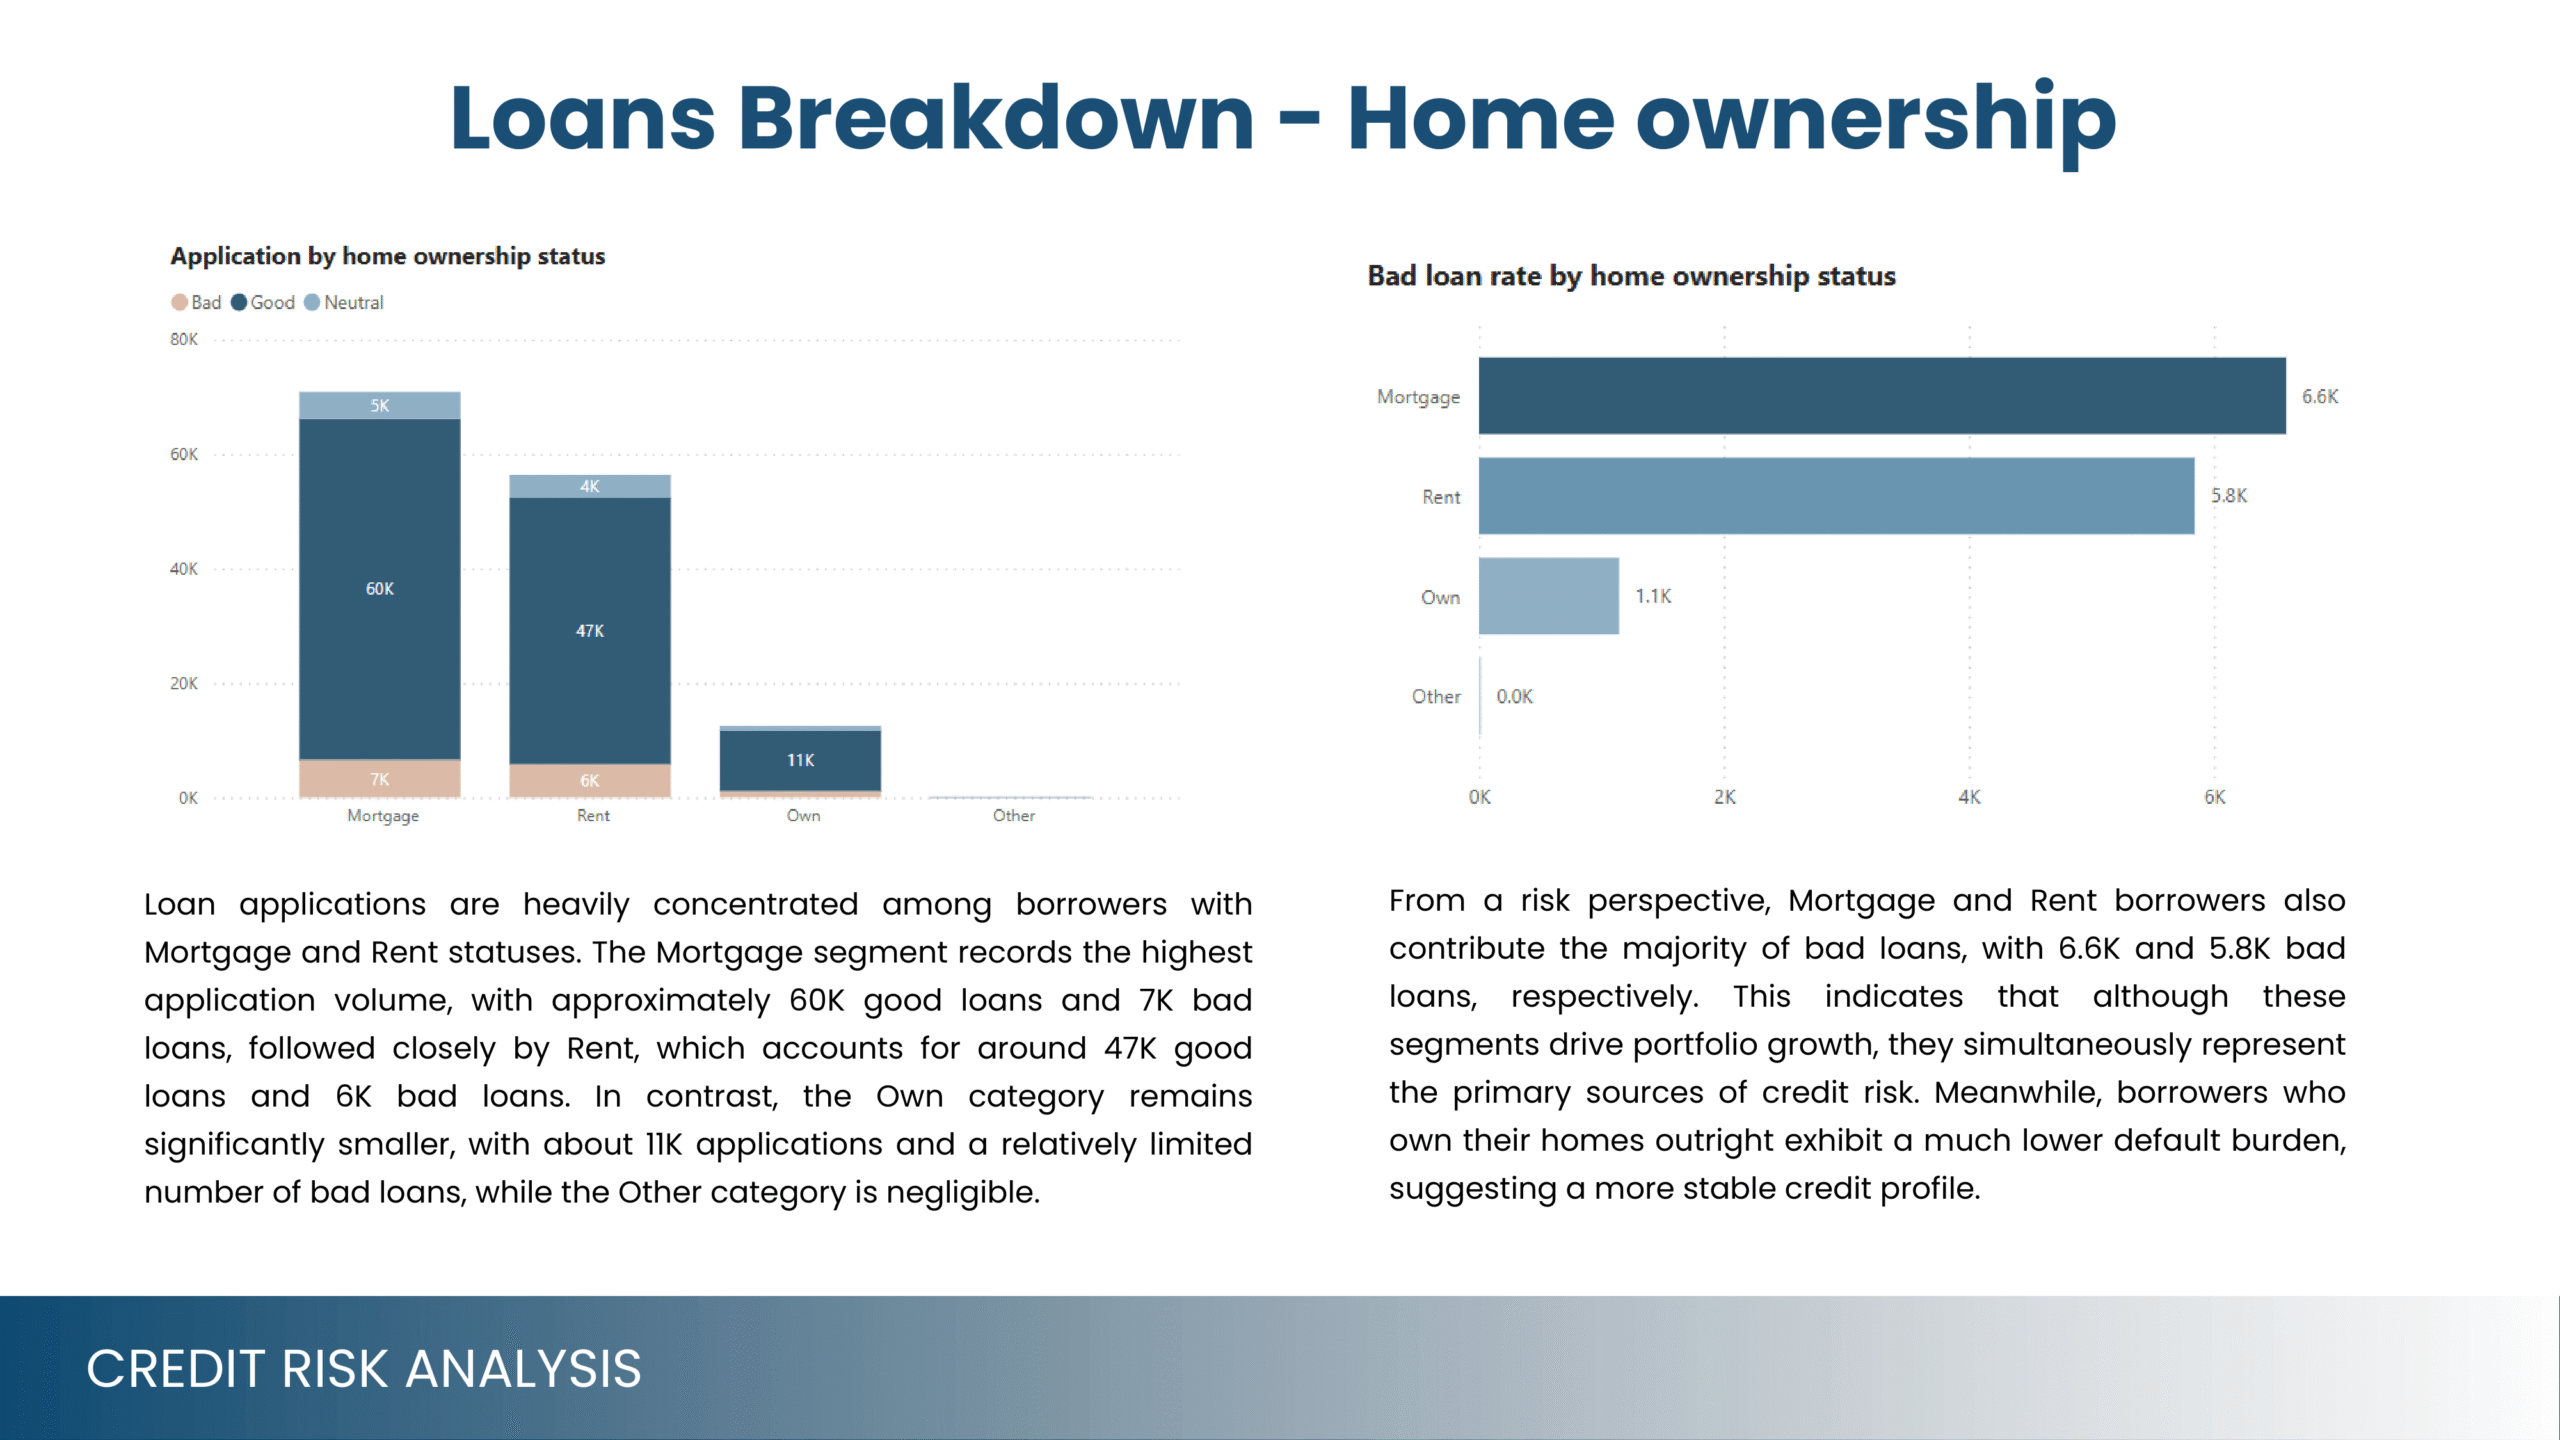
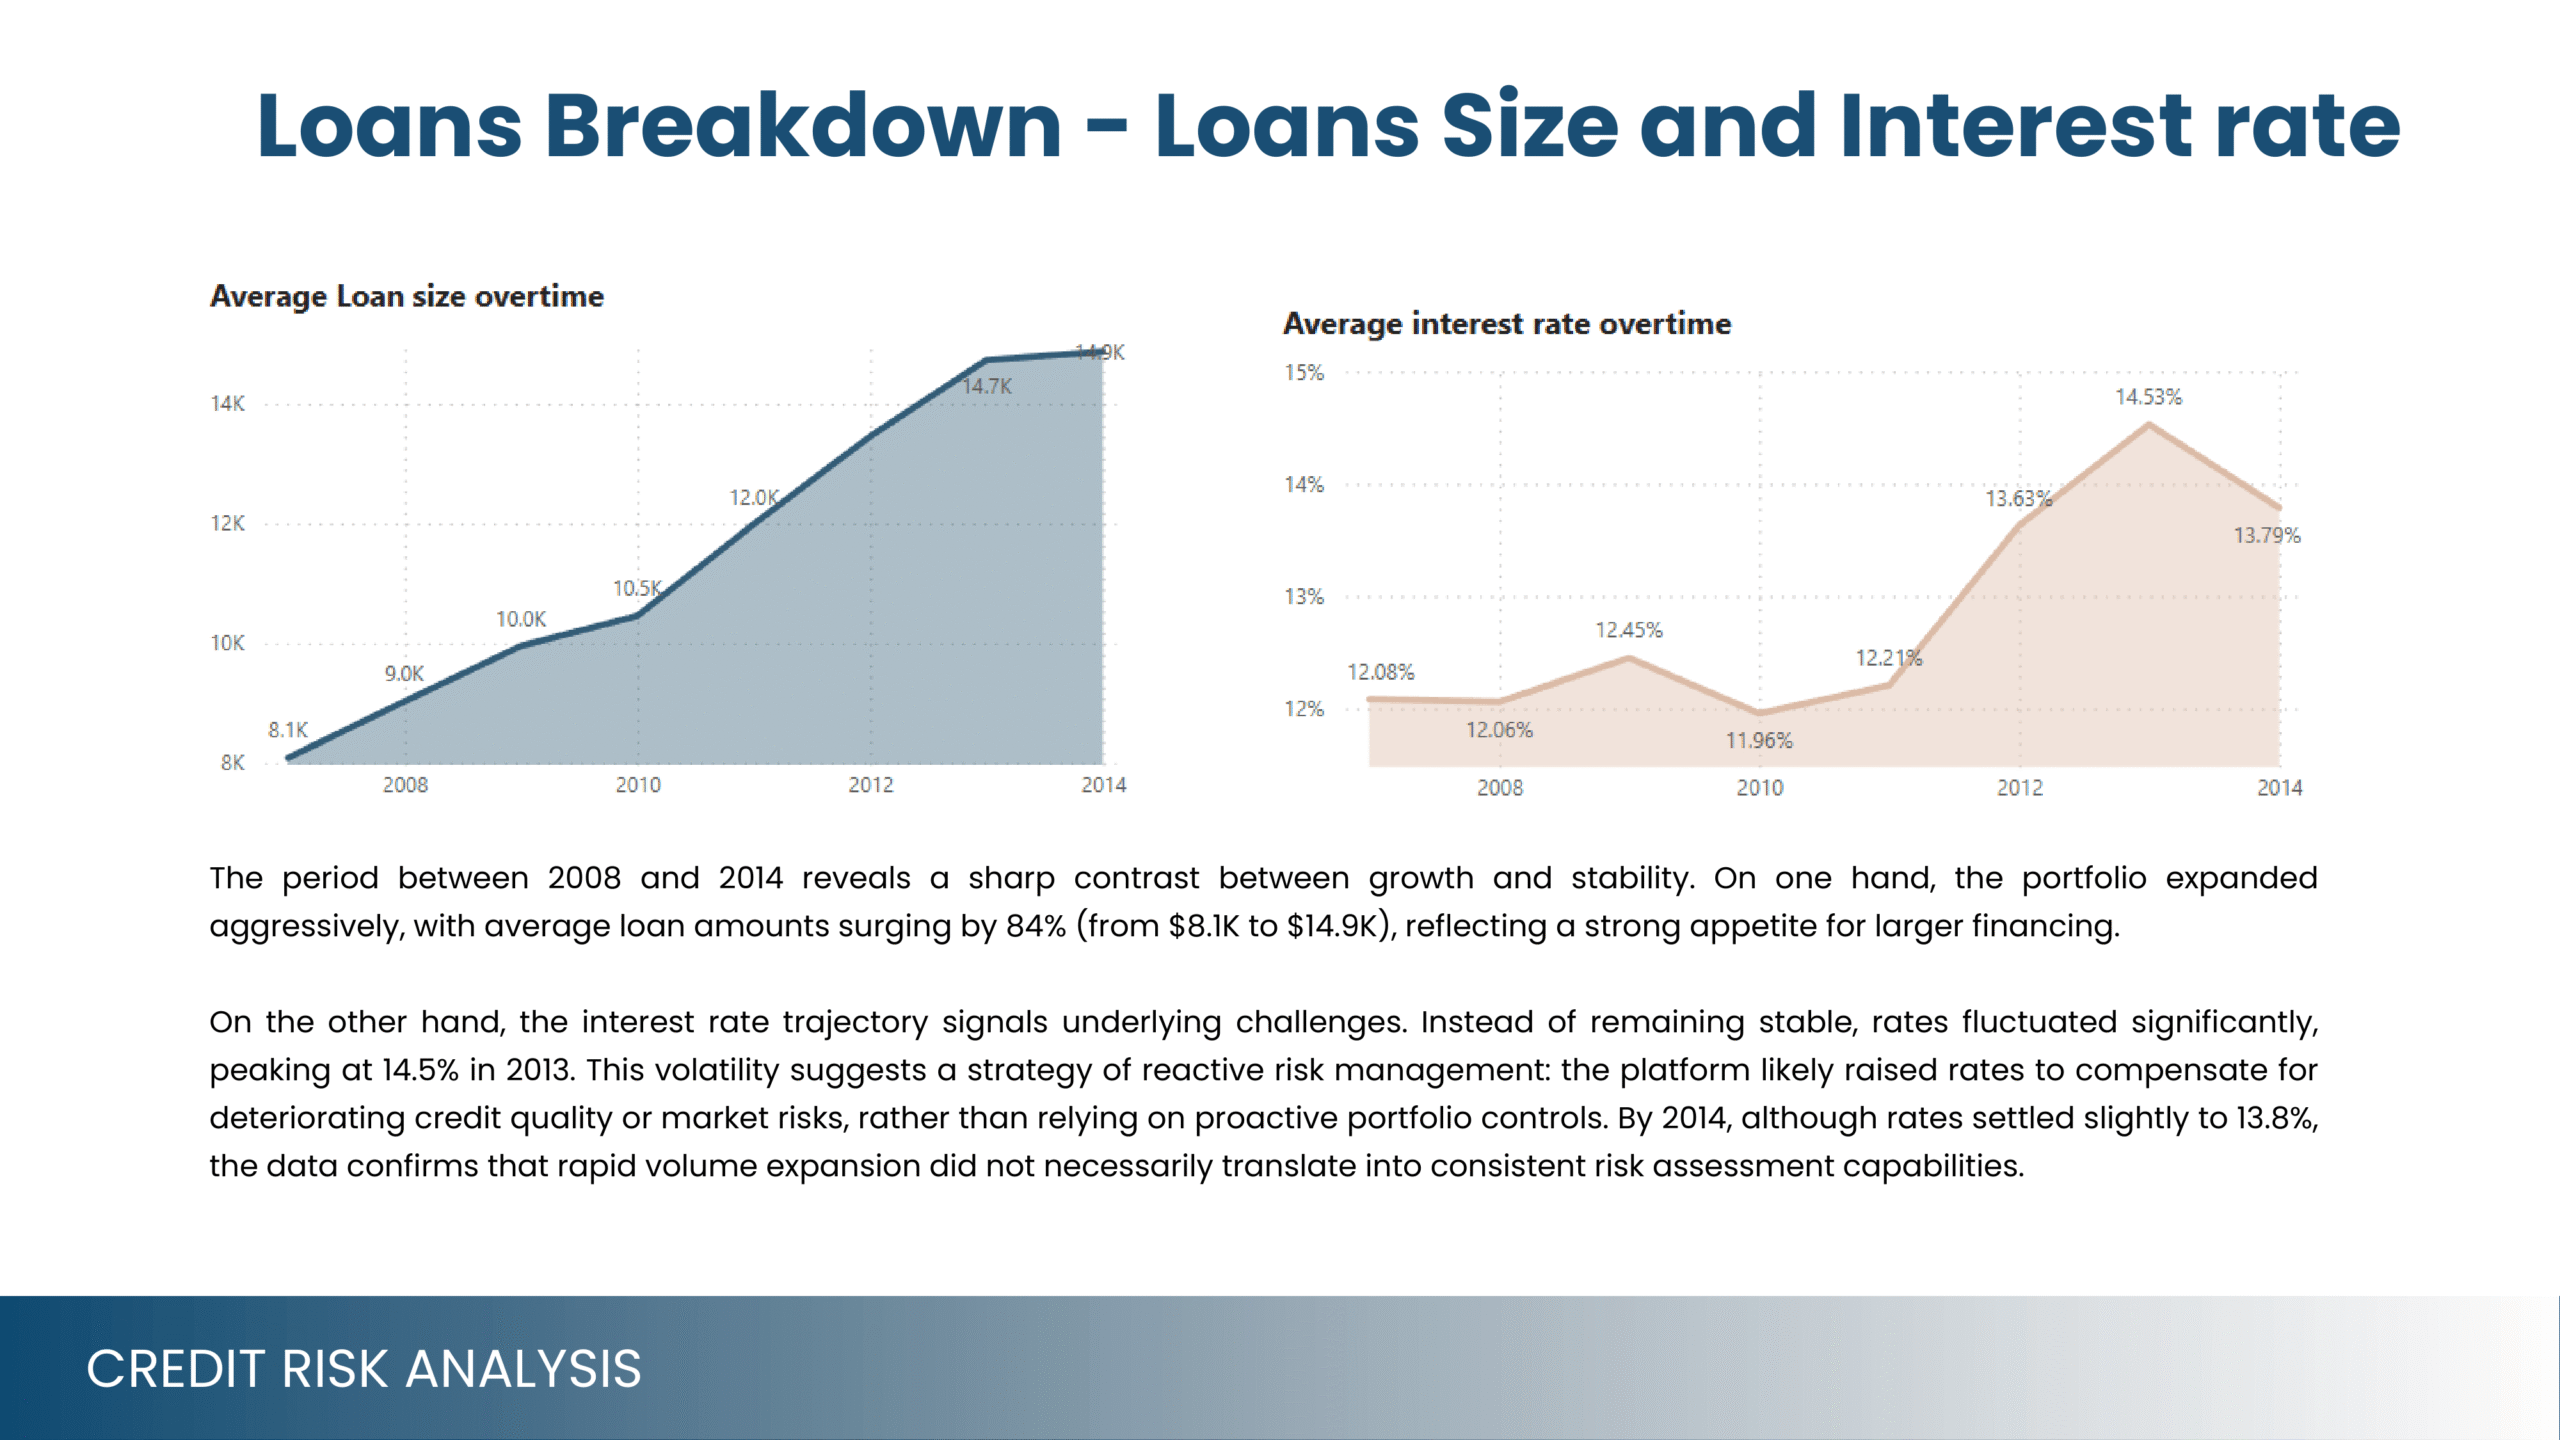
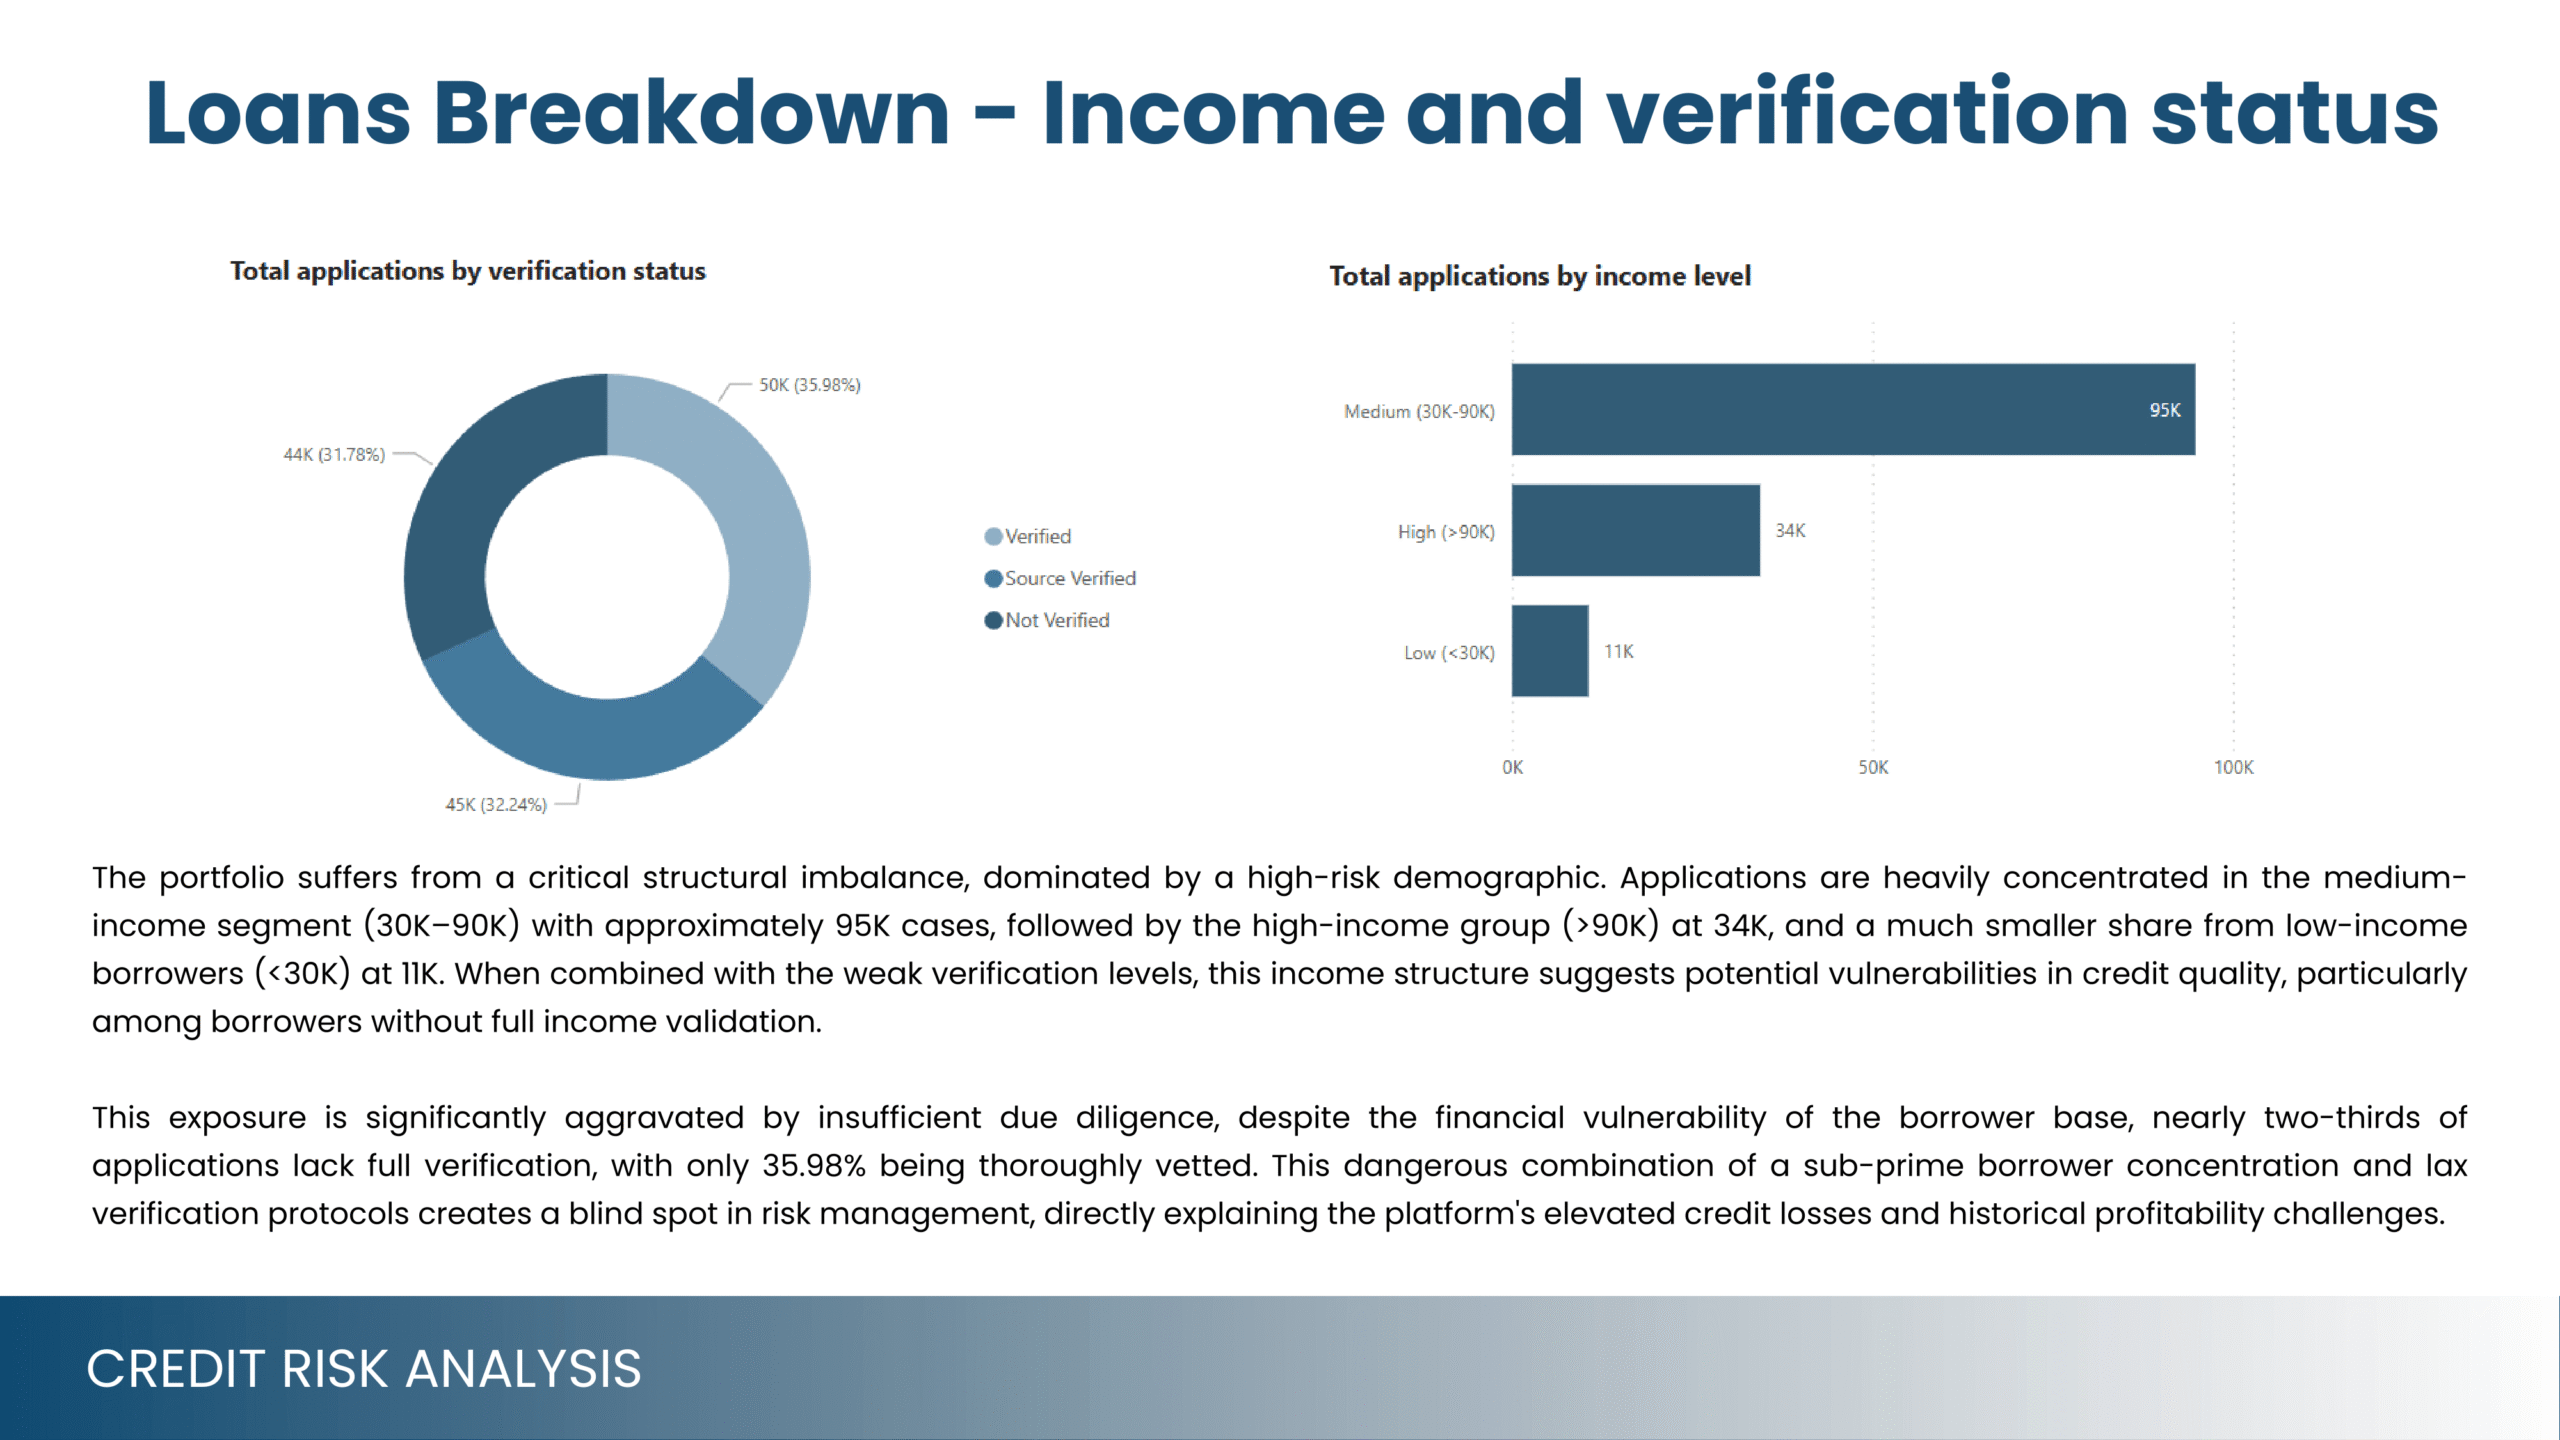

The project focused on analyzing credit risk in a peer-to-peer lending platform using historical loan data from 2007 to 2014. In response to the post-crisis surge in loan applications, using Power BI explores loan records and identifies behavioral patterns that distinguish good loans from bad ones based on credit profile, debt management pattern, financial capability and loan structure. The goal was to provide data-driven insights and recommendations to help reduce default risk and improve lending strategies through better borrower segmentation and risk monitoring.