")
Project 1: Food Delivery Dashboard
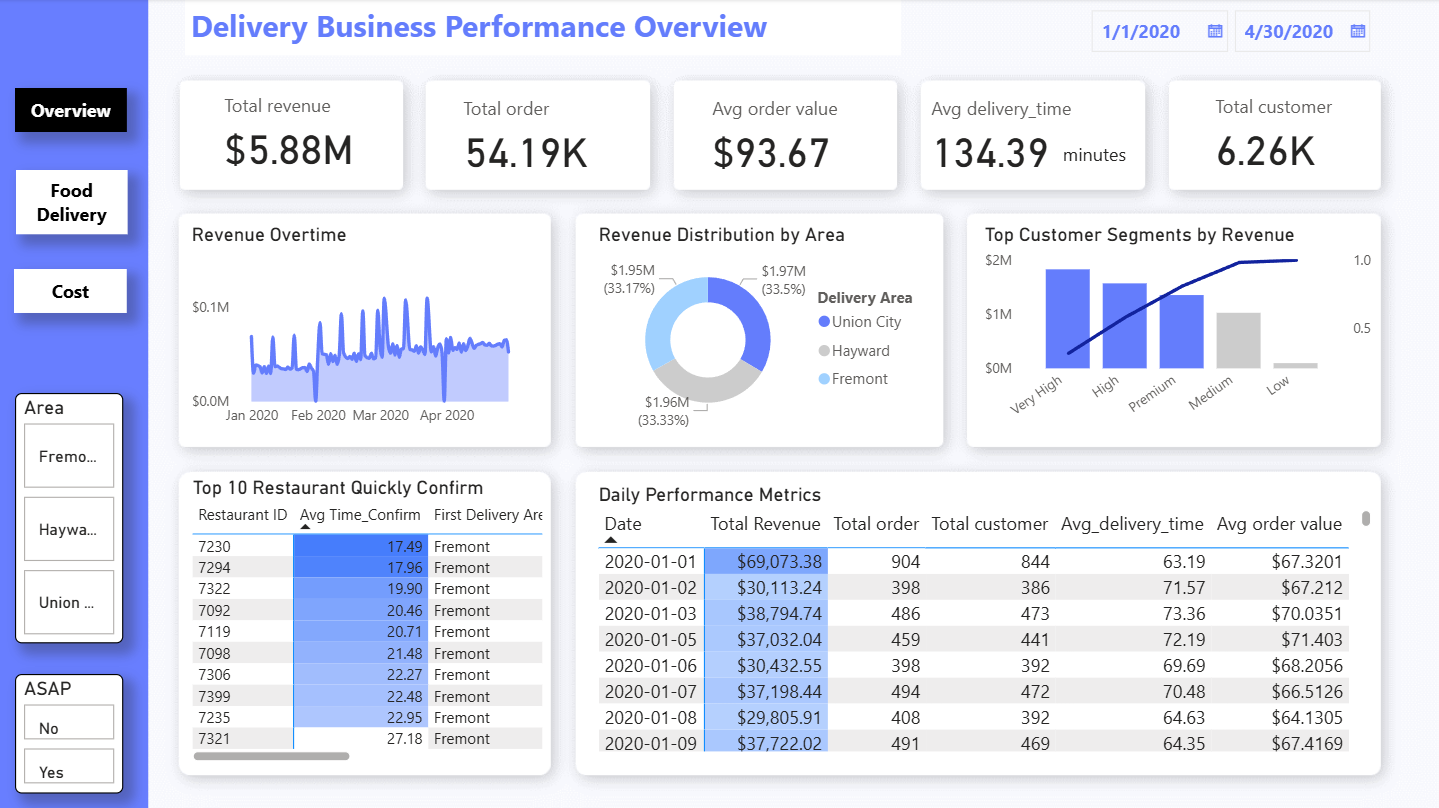
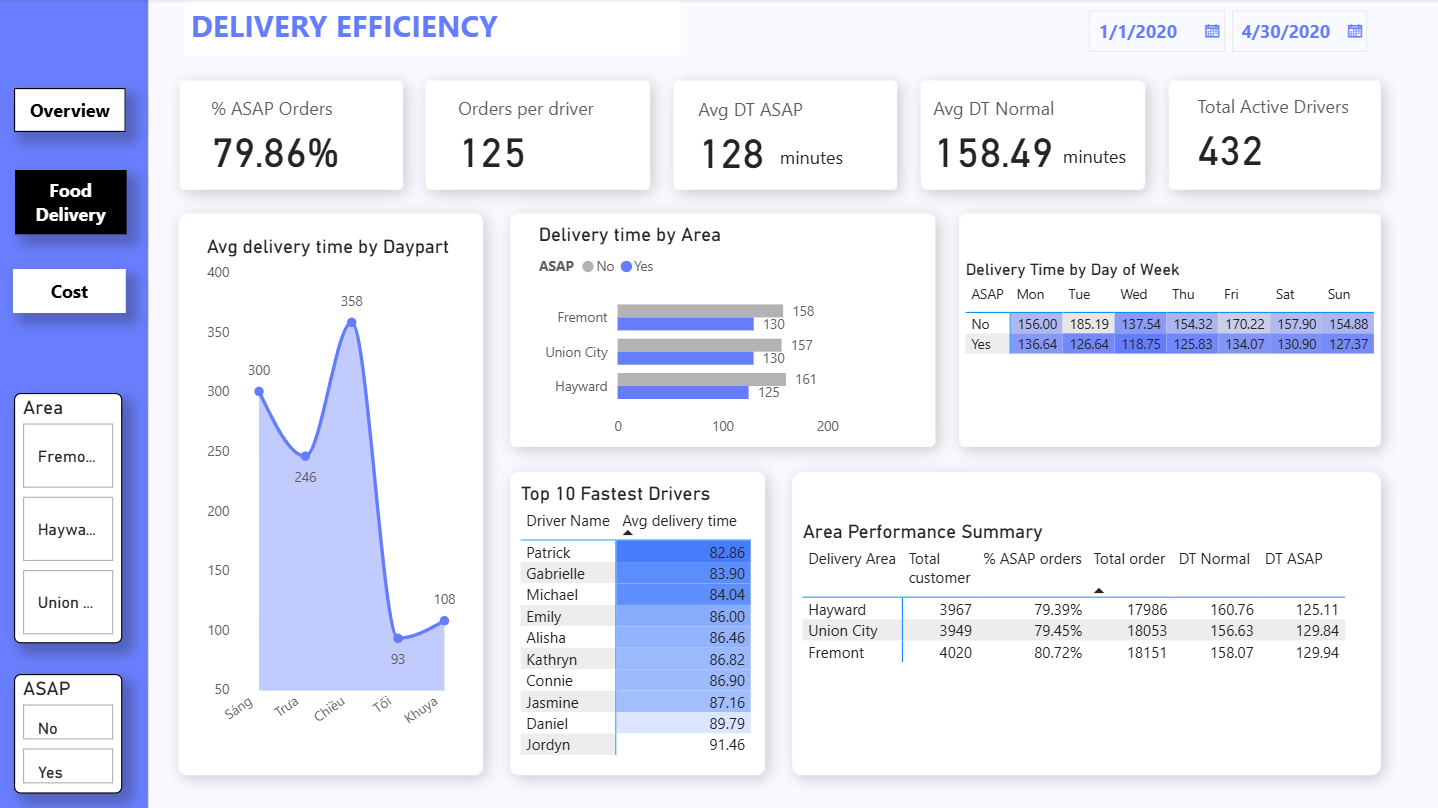
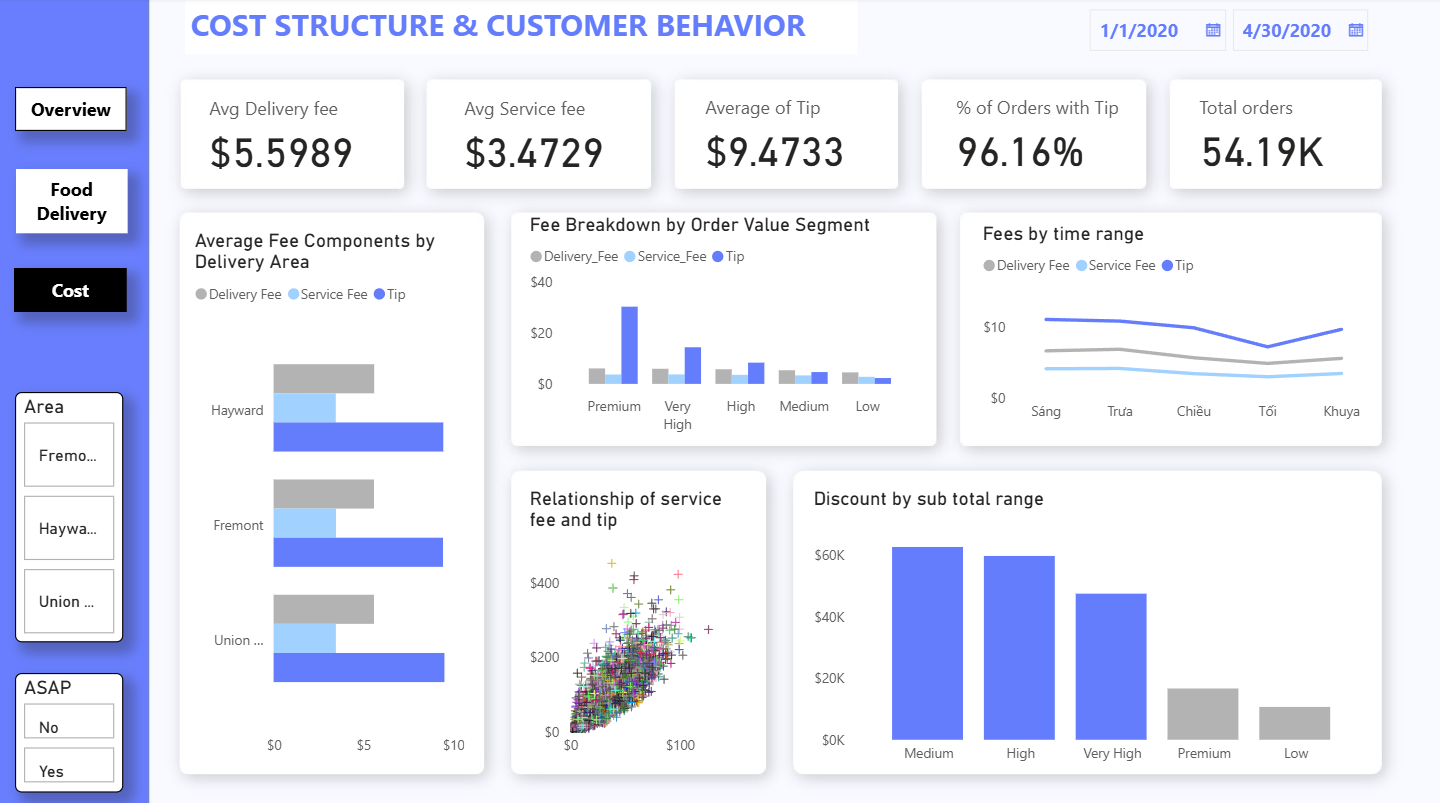
This project analyzes food delivery operations using January 2020 order data. Power BI was used to explore metrics such as delivery time, restaurant prep time, driver tips, revenue, and customer volume. The analysis identified performance patterns across drivers, restaurants, and delivery flows. Insights supported improvements in operational efficiency, customer satisfaction, and overall service quality.
Skills Applied:
-
Define service performance metrics including delivery speed, prep time, and driver efficiency.
-
Connect, clean & transform delivery order data for accurate operational analysis.
-
Analyze & visualize performance trends in Power BI by driver, restaurant, and order flow.
-
Publish interactive dashboards to support operations improvement and customer satisfaction.
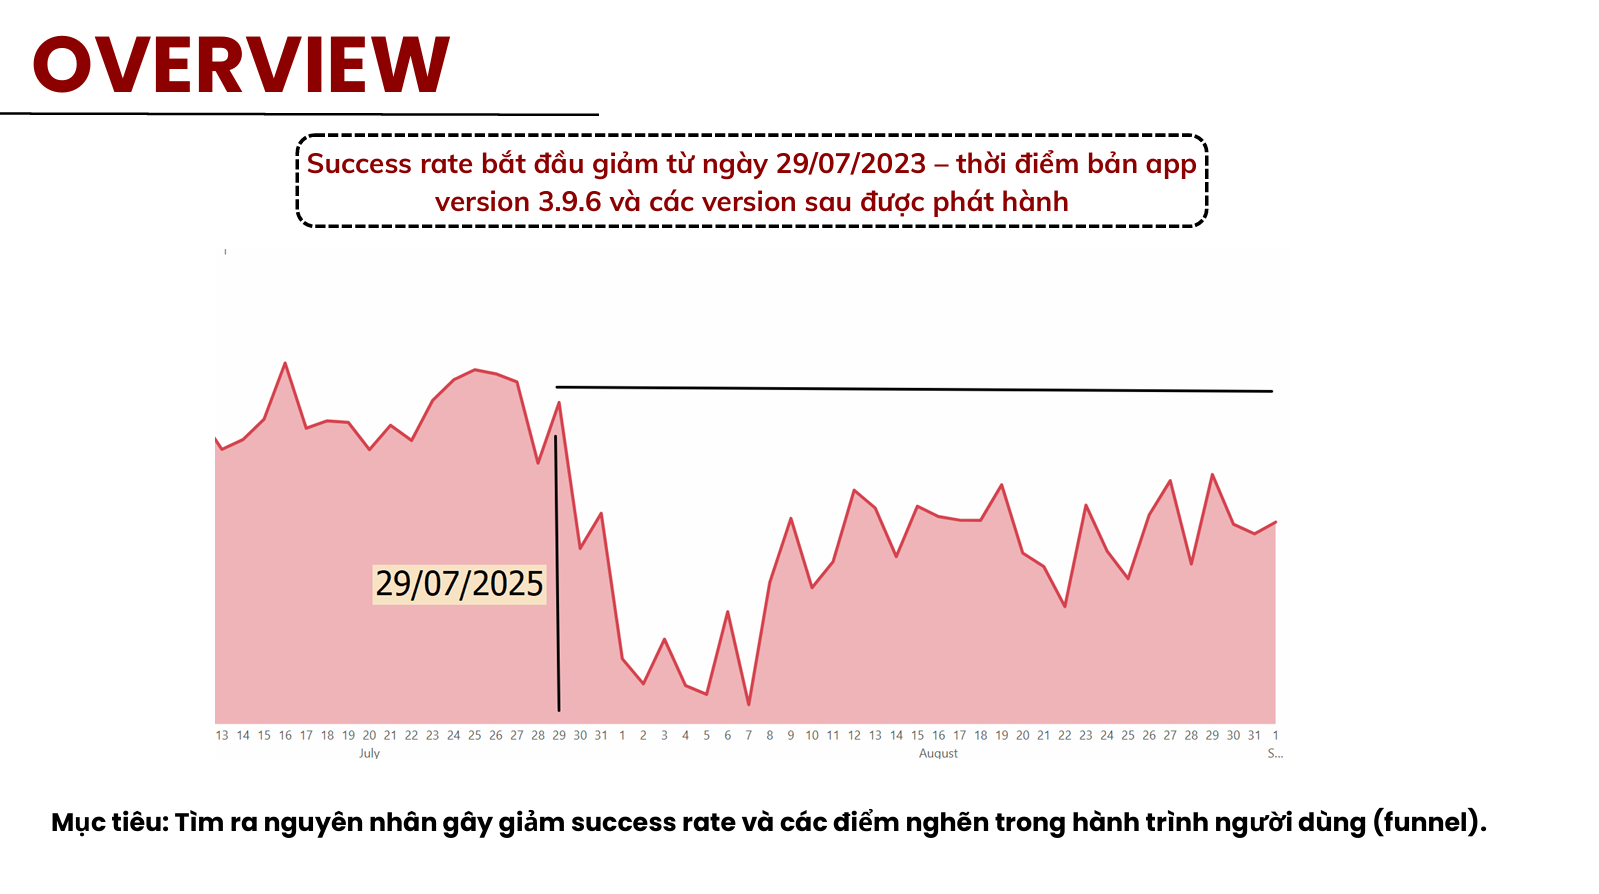
Project 2: App Optimization Analysis
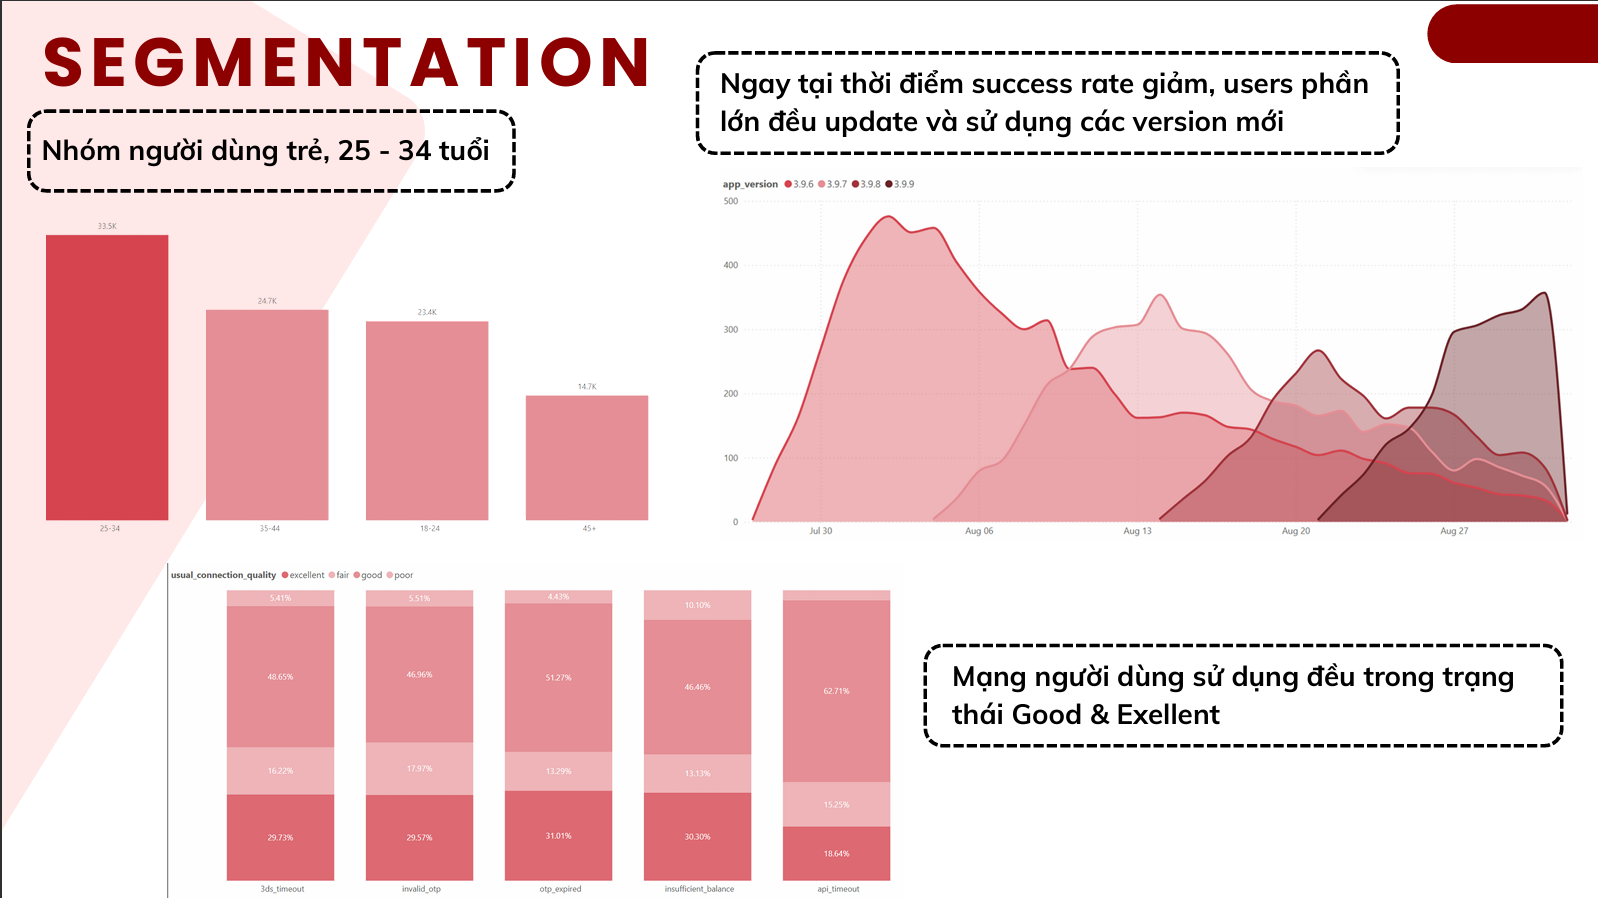
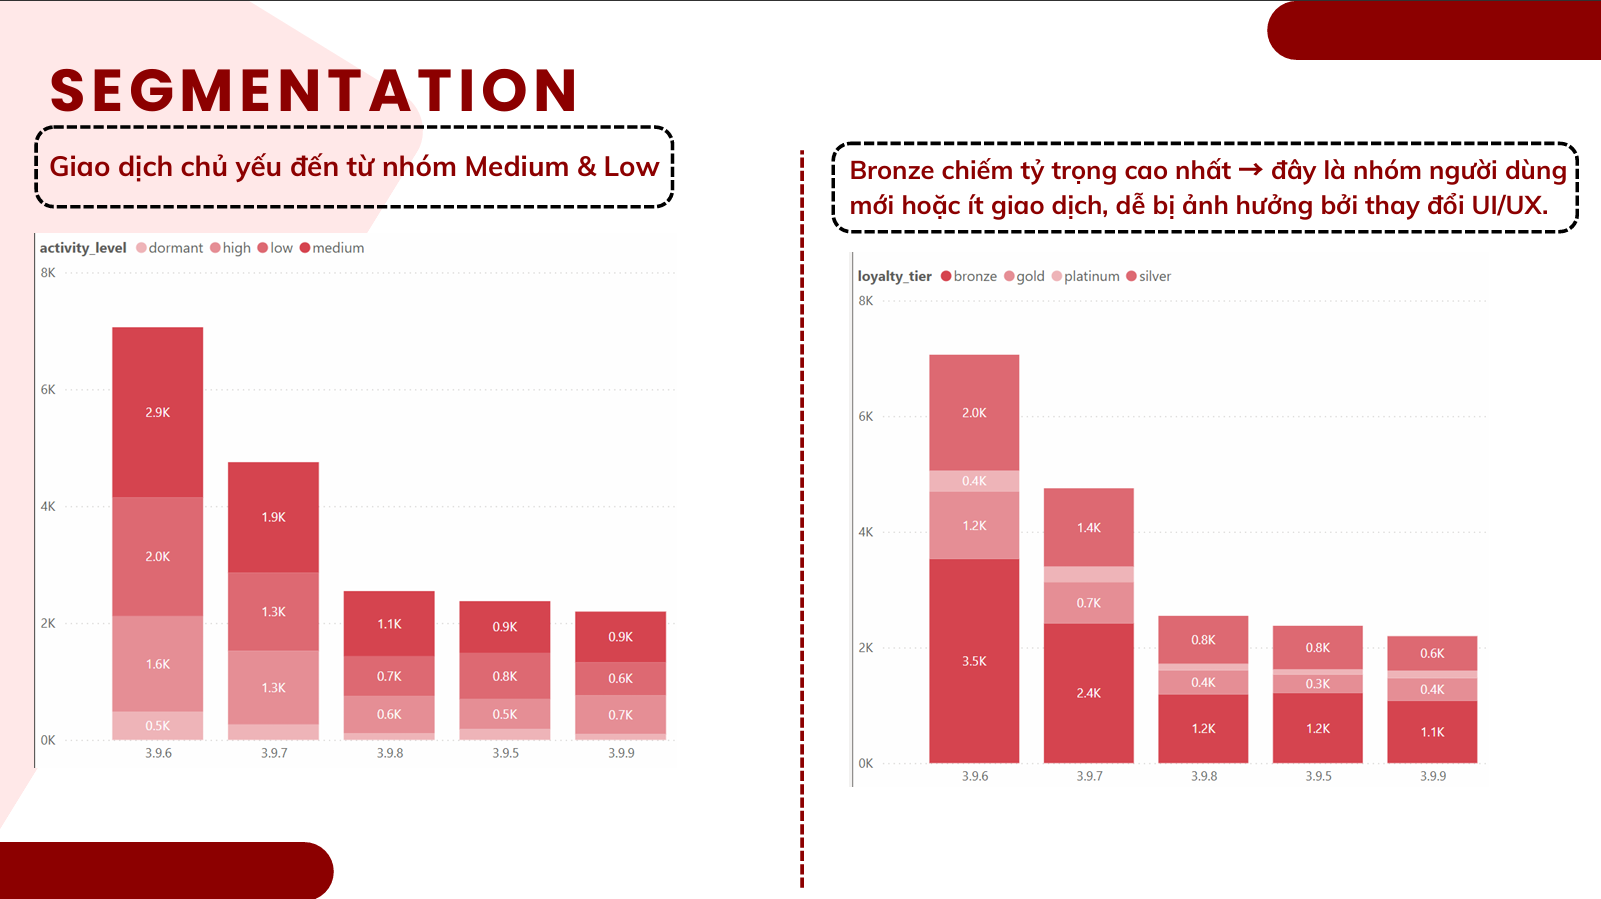
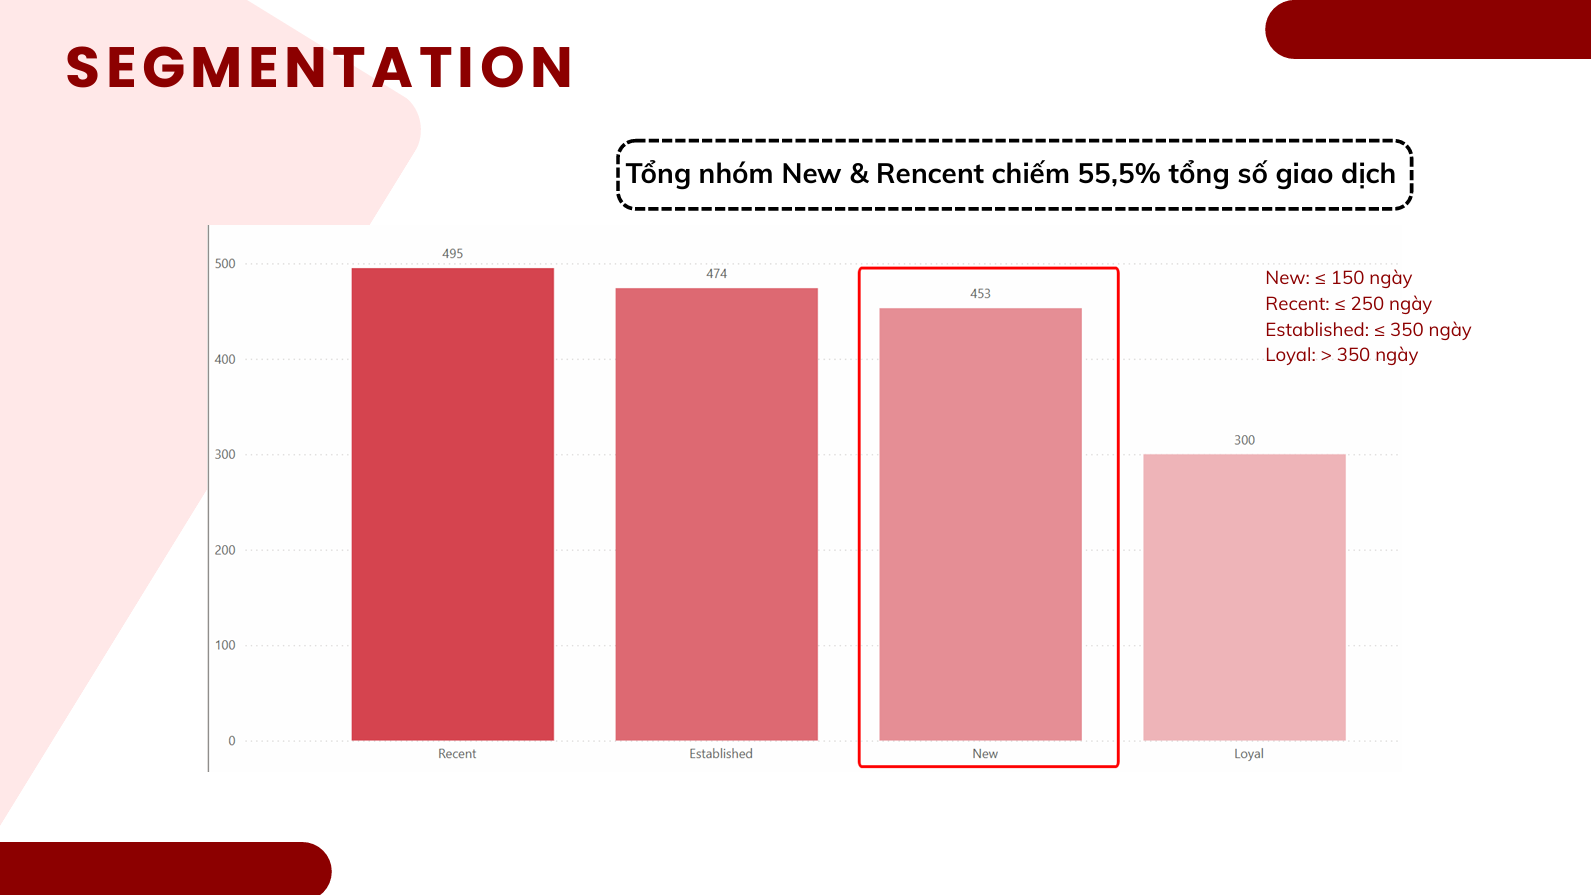
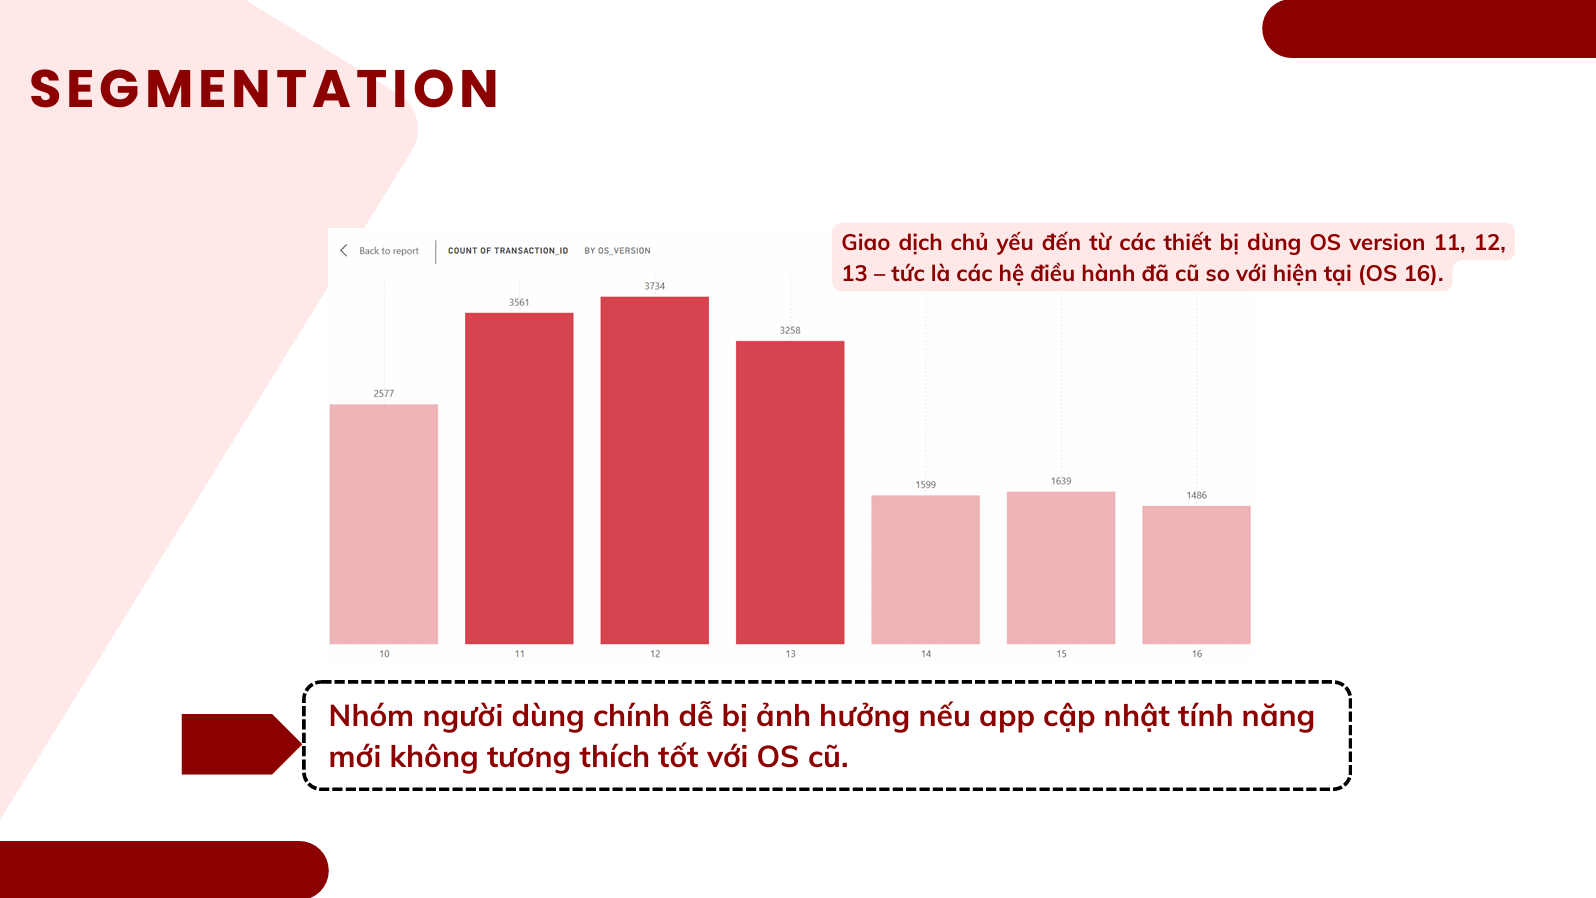
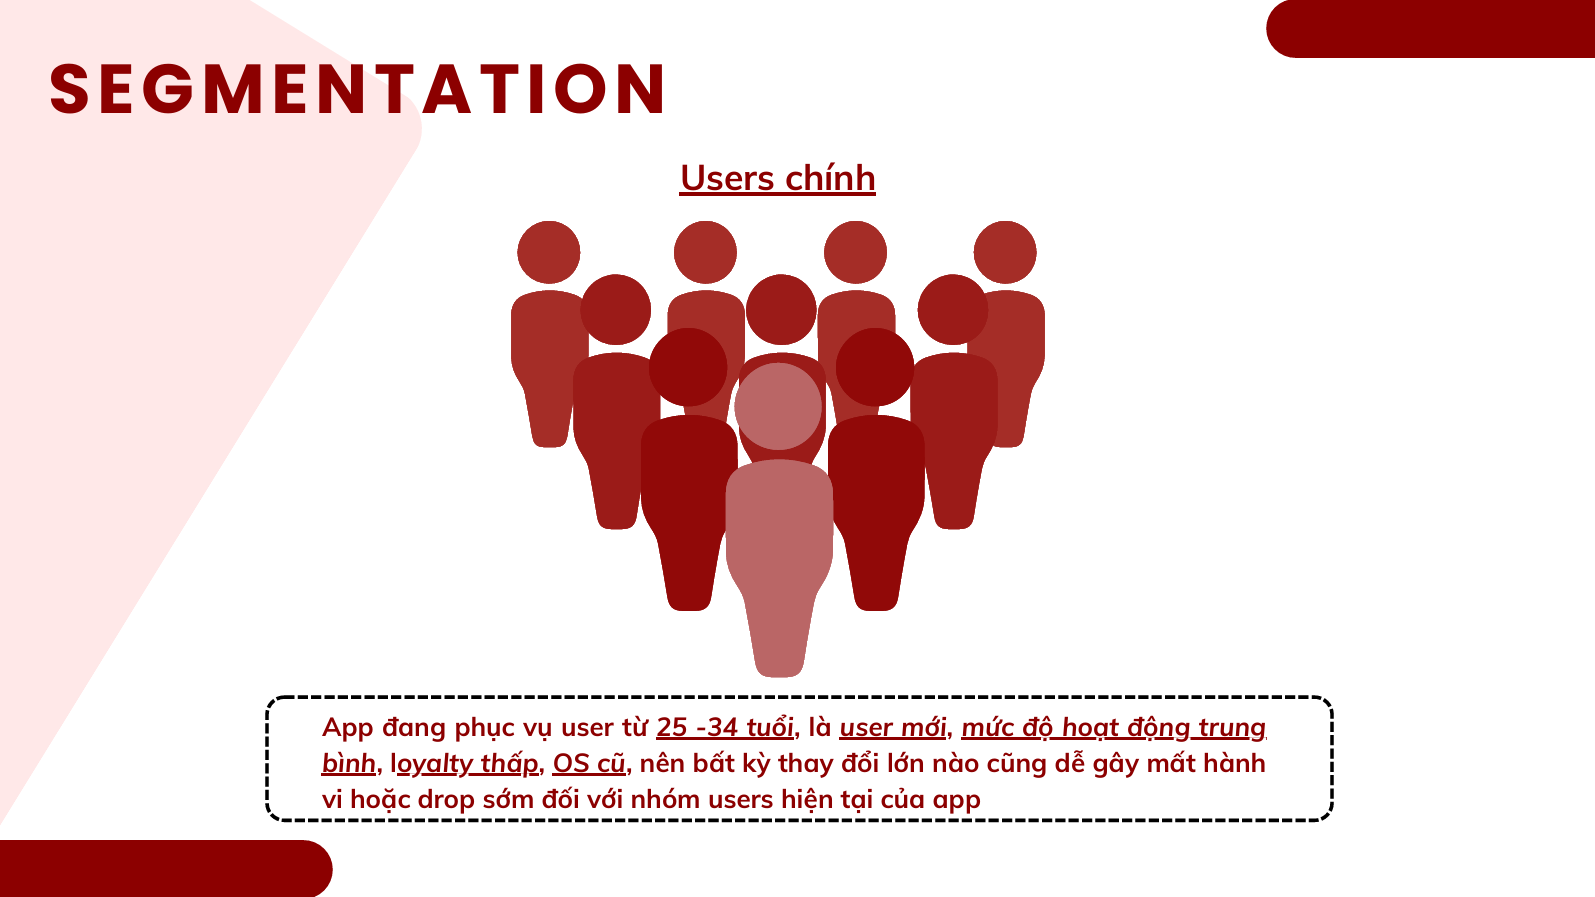
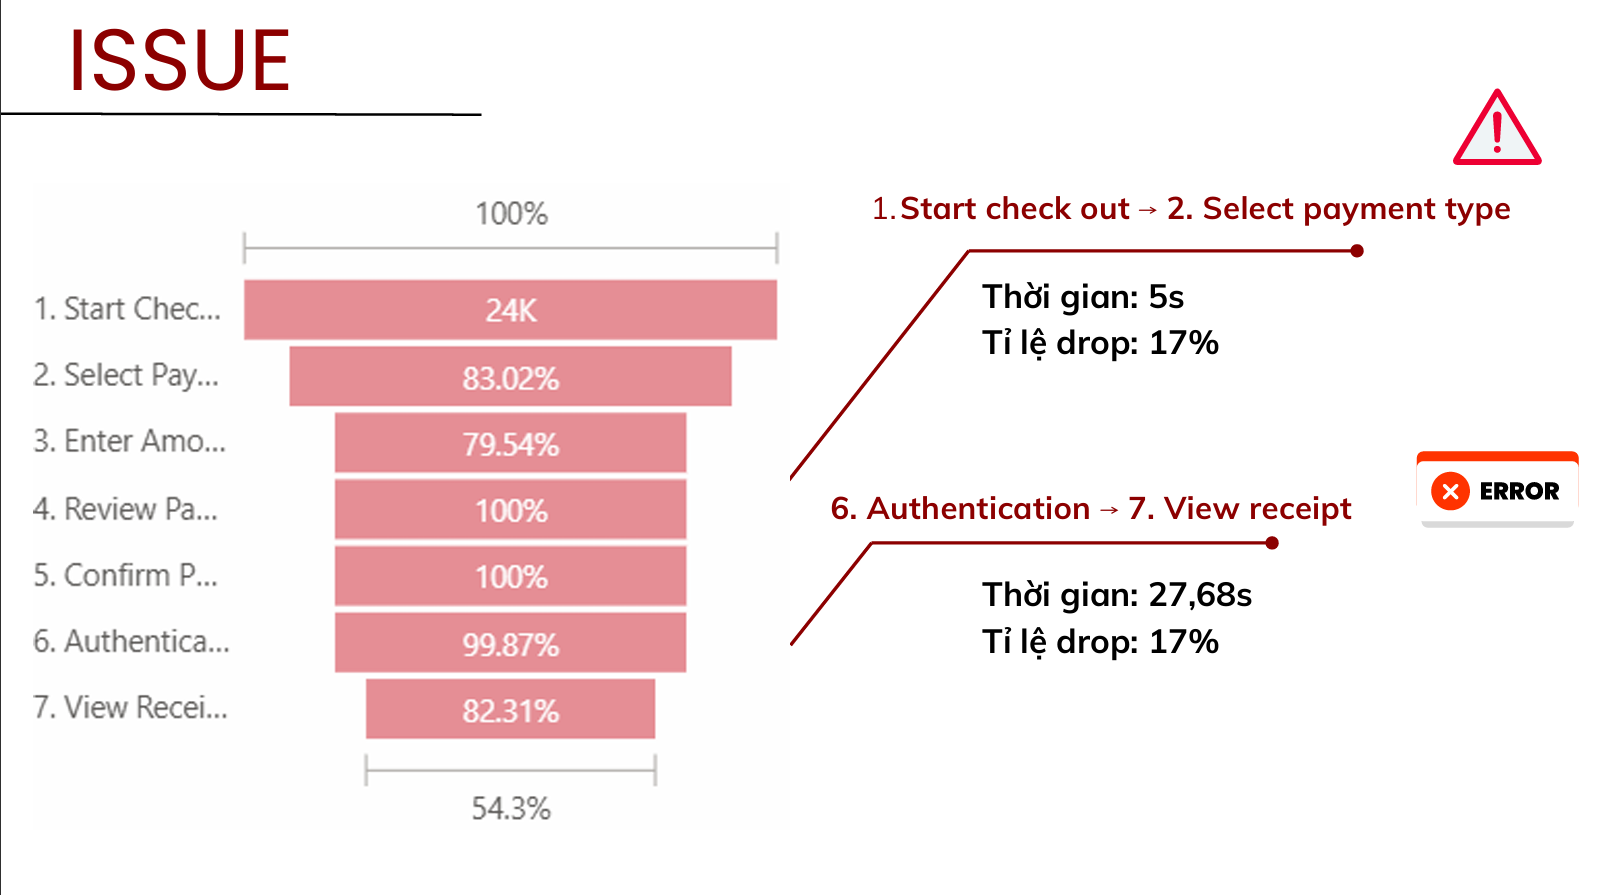
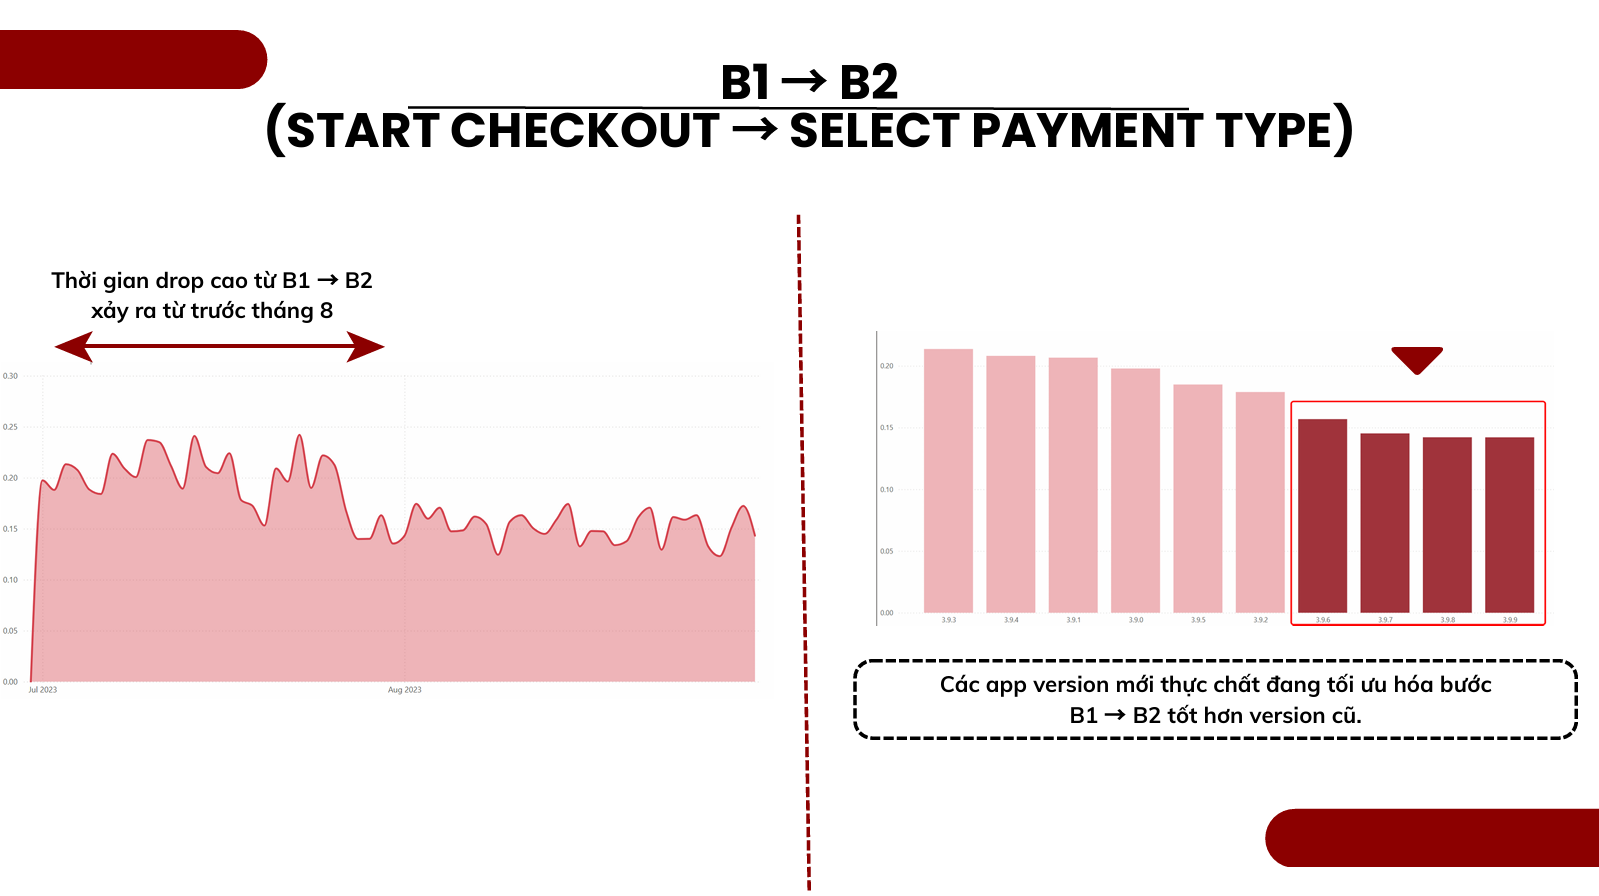
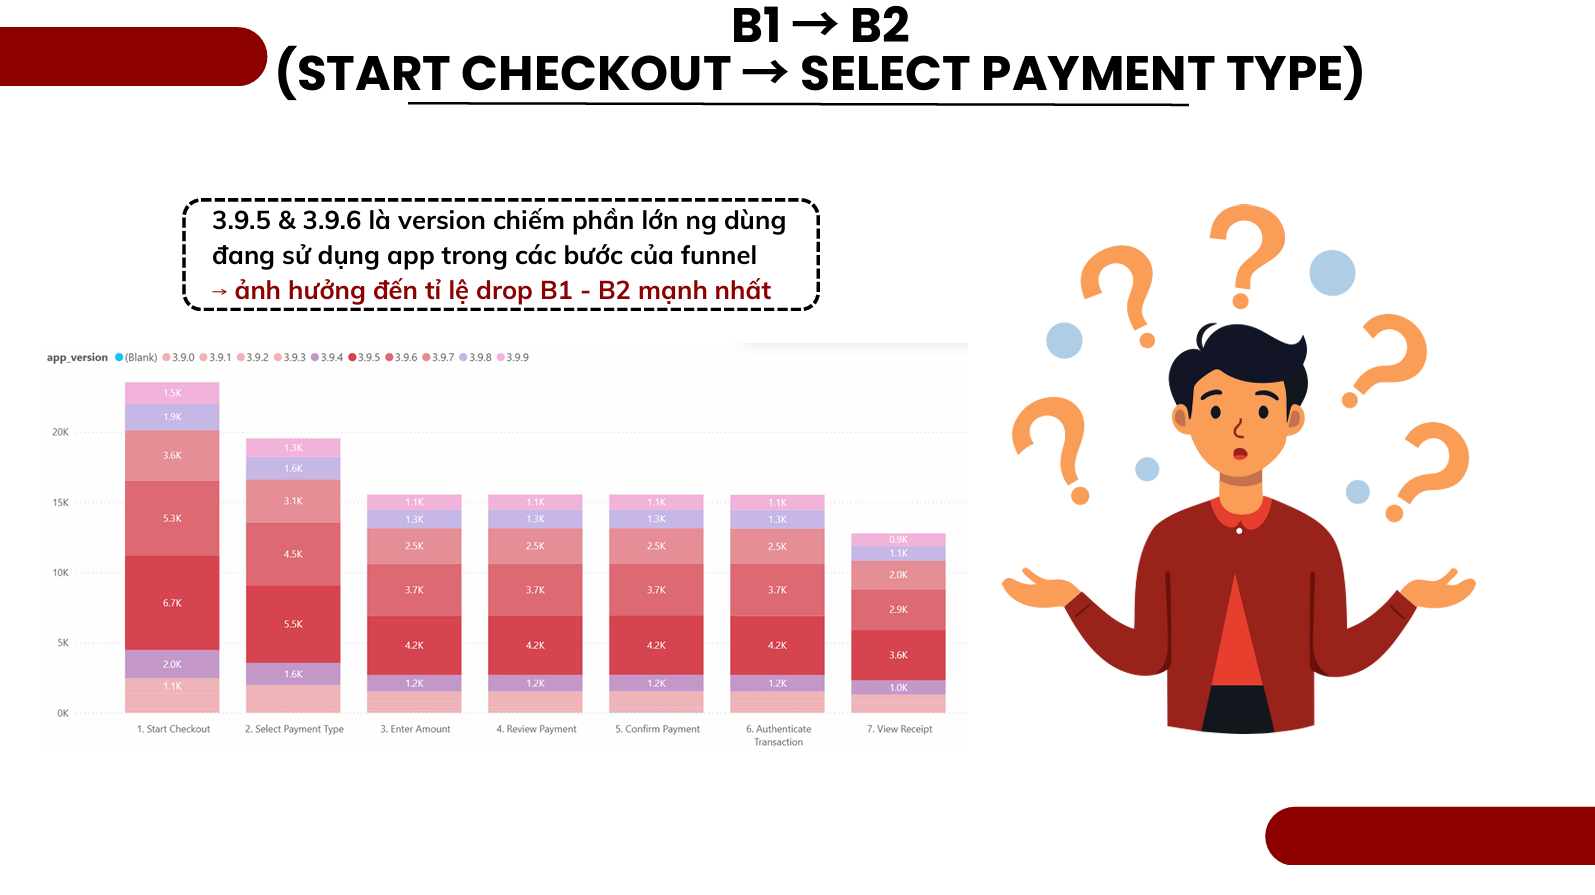
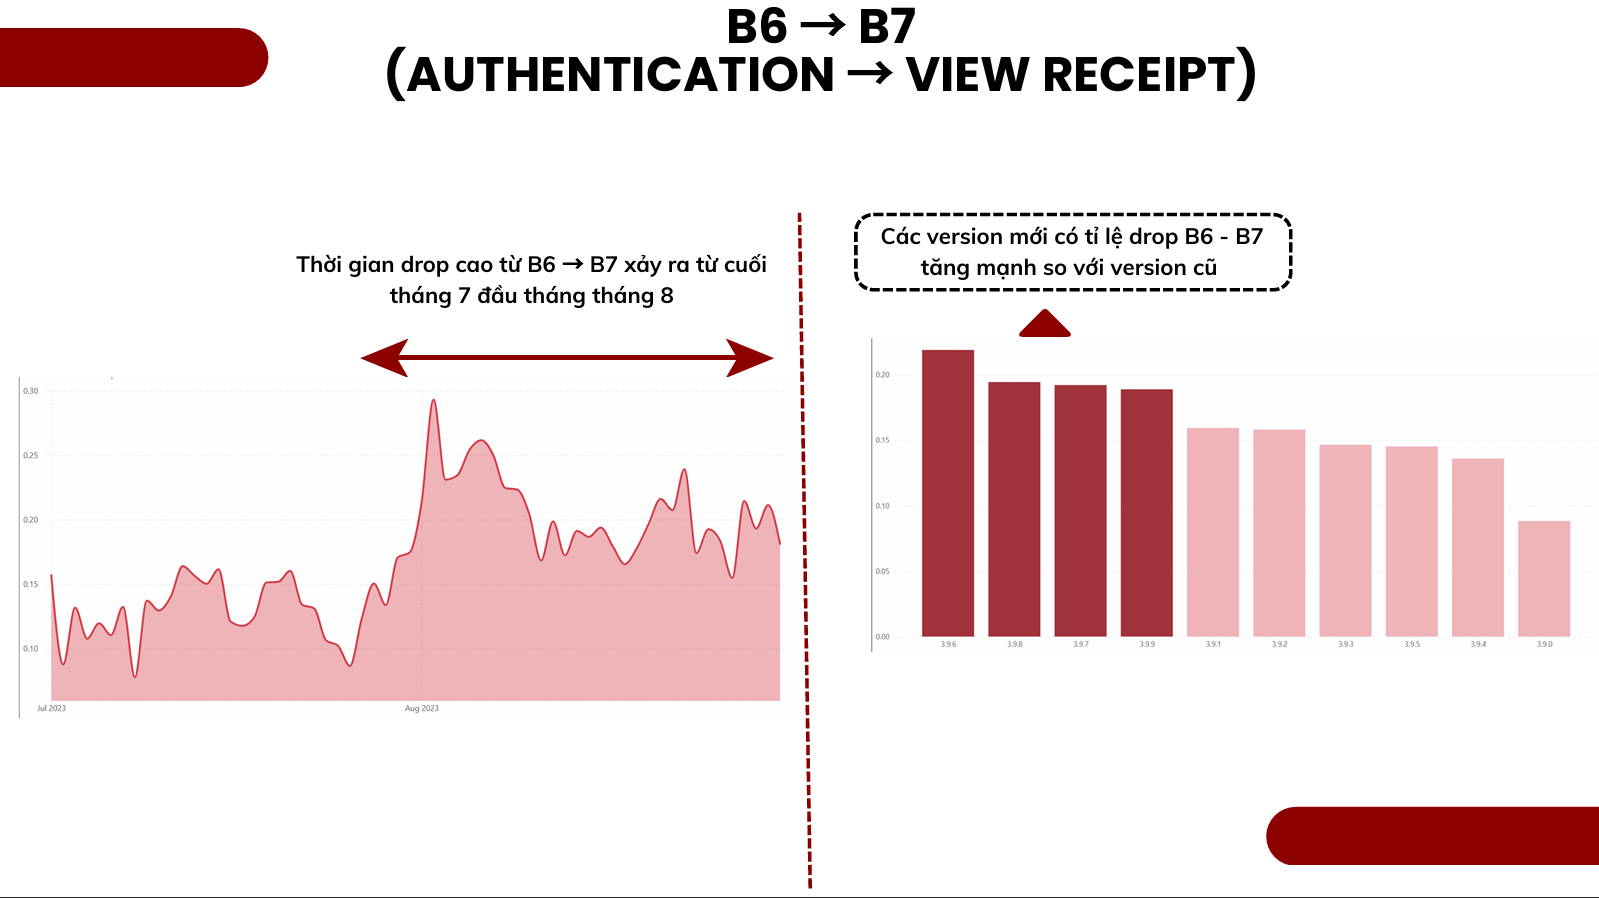
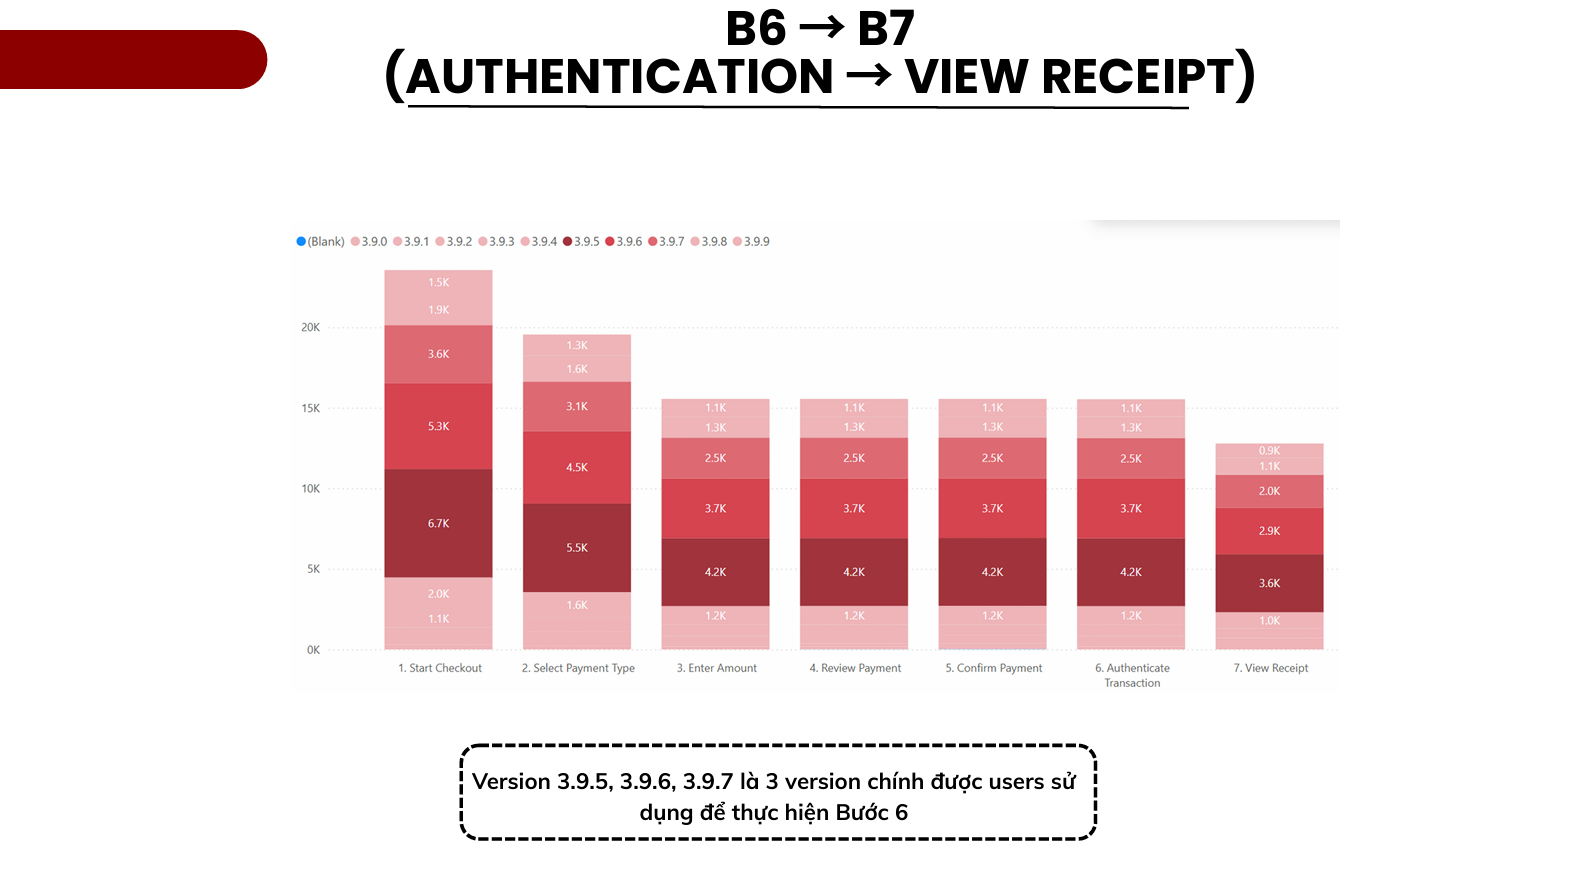
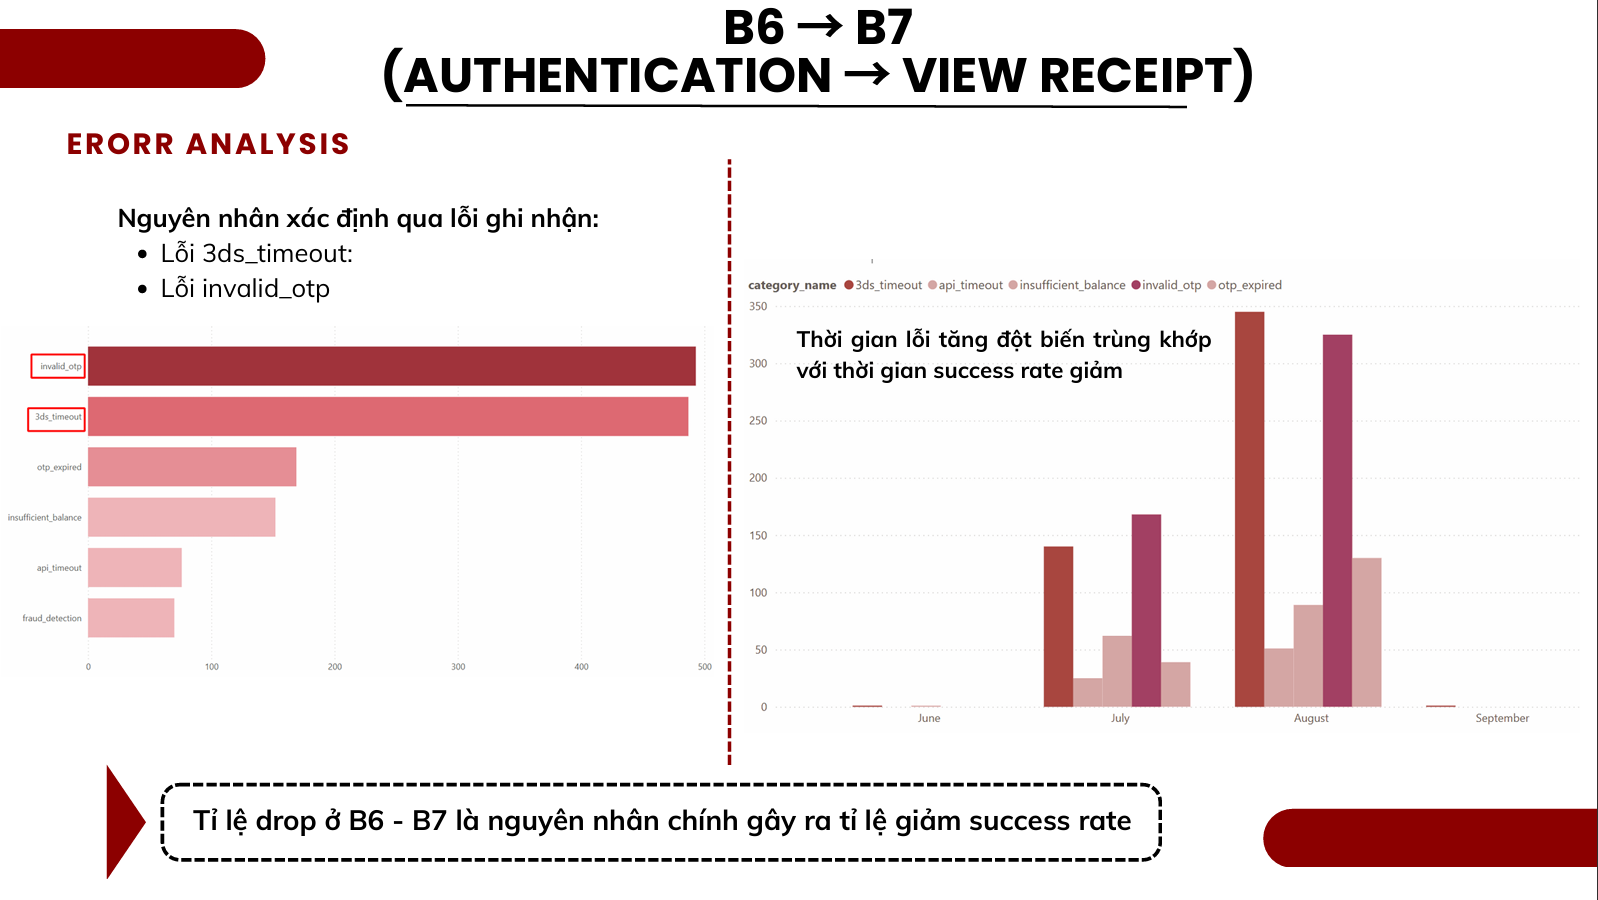
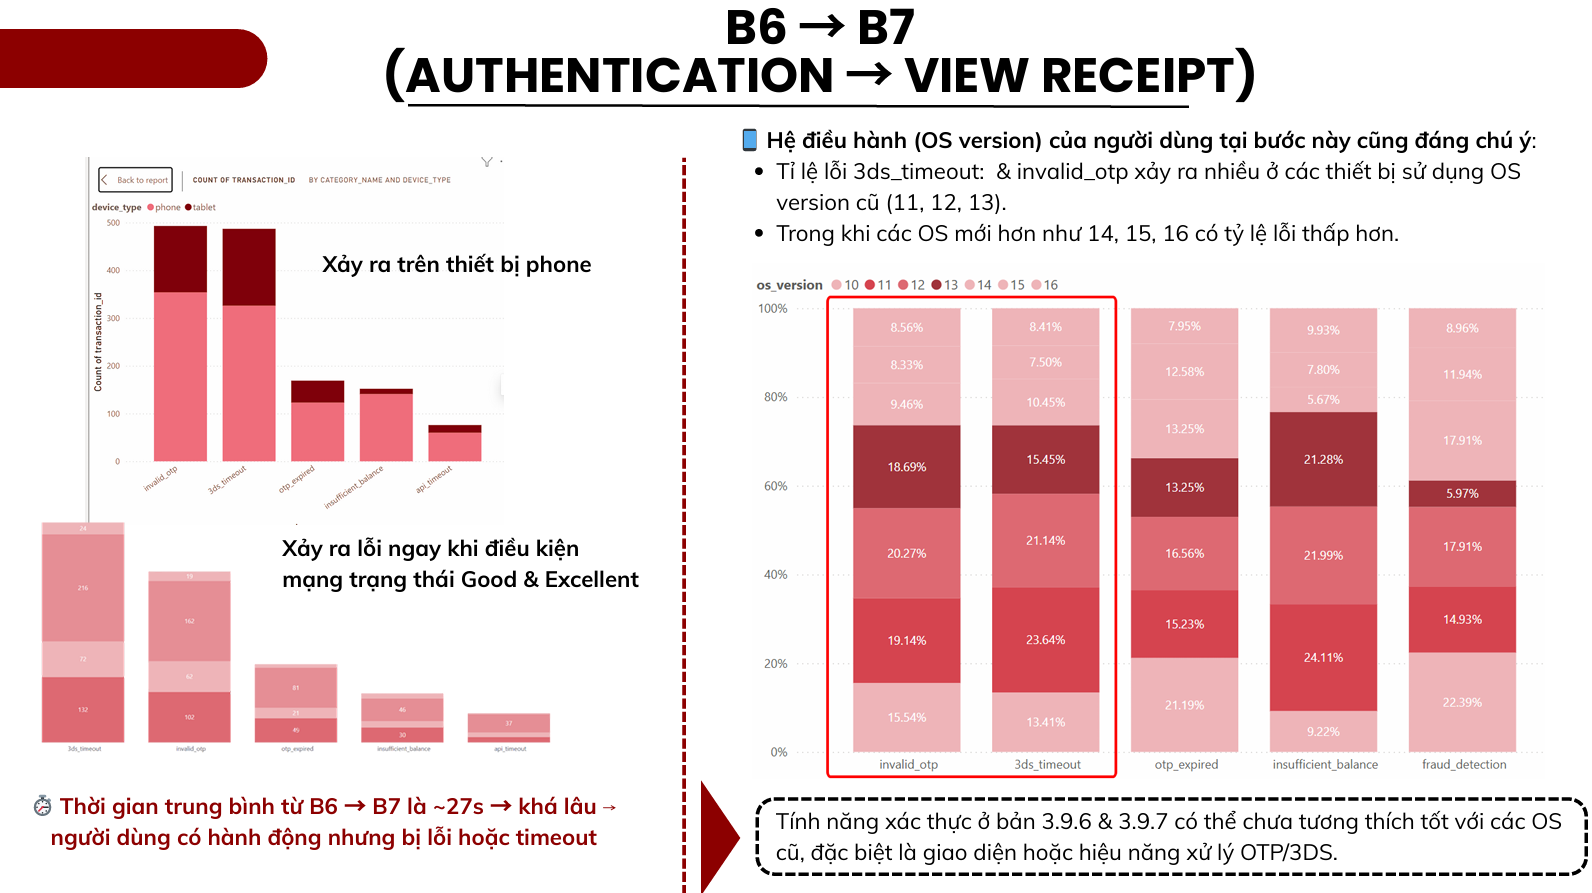
The project analyzes the decline in bill payment success rate on an e-wallet app since August 2025 using transactional, session, event log, and error data. Power BI and the MECE framework were applied to identify failure points across the payment journey, including authentication, gateway redirects, and app version issues. Key insights highlighted correlations between failure rates and user segments, device types, and network quality. The analysis led to actionable recommendations to optimize payment flows and reduce error impact.
Skills Applied:
-
Define optimization objectives & KPIs for payment success rate, error frequency, and user flow completion.
-
Connect, clean & integrate multi-source datasets (transactions, sessions, logs, error categories).
-
Analyze & visualize payment journey bottlenecks in Power BI using MECE breakdown.
-
Publish interactive dashboards to help product and engineering teams track and resolve issues.
-
Prepare slides & use storytelling techniques to present insights and solutions to stakeholders.