Project 1: Sales Performance Dashboard
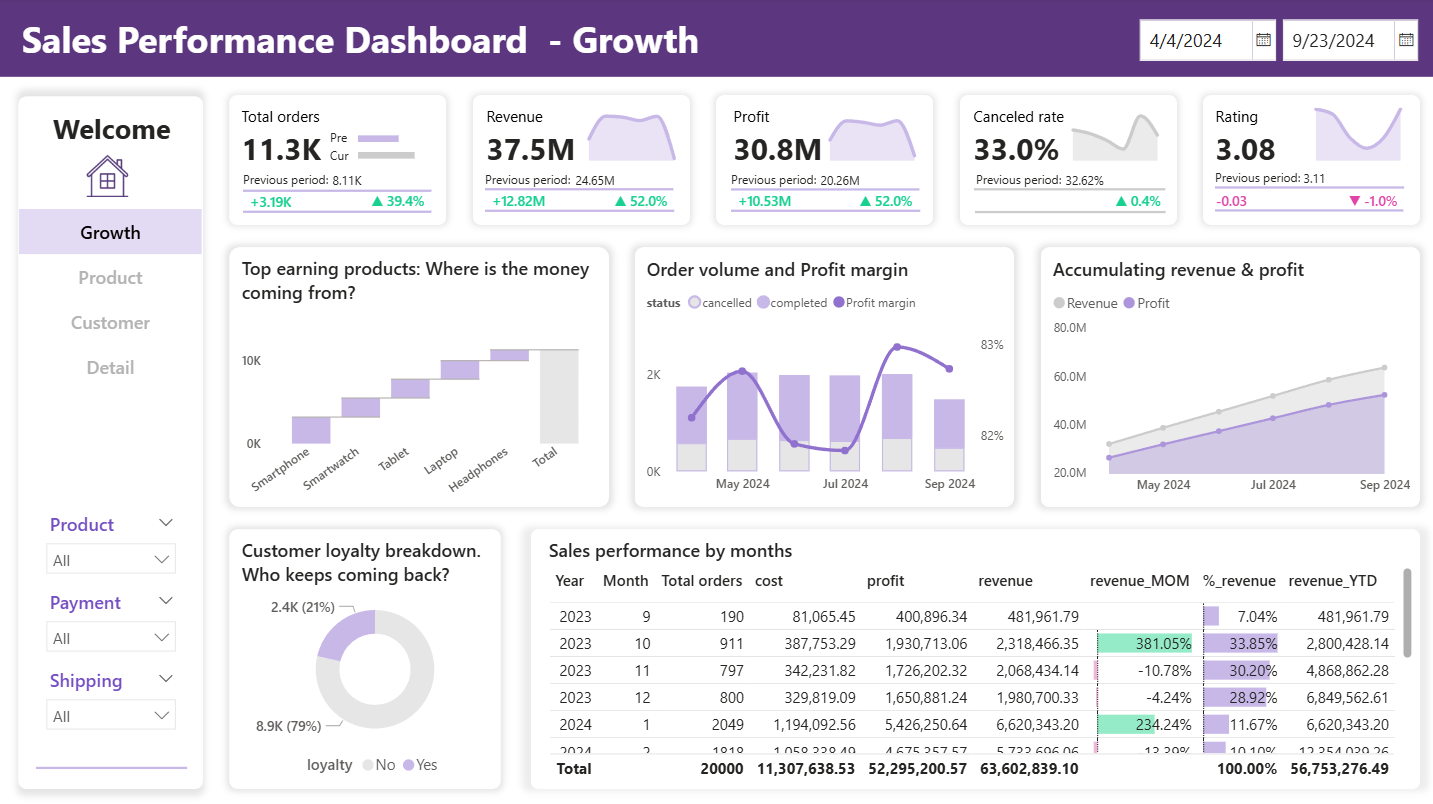
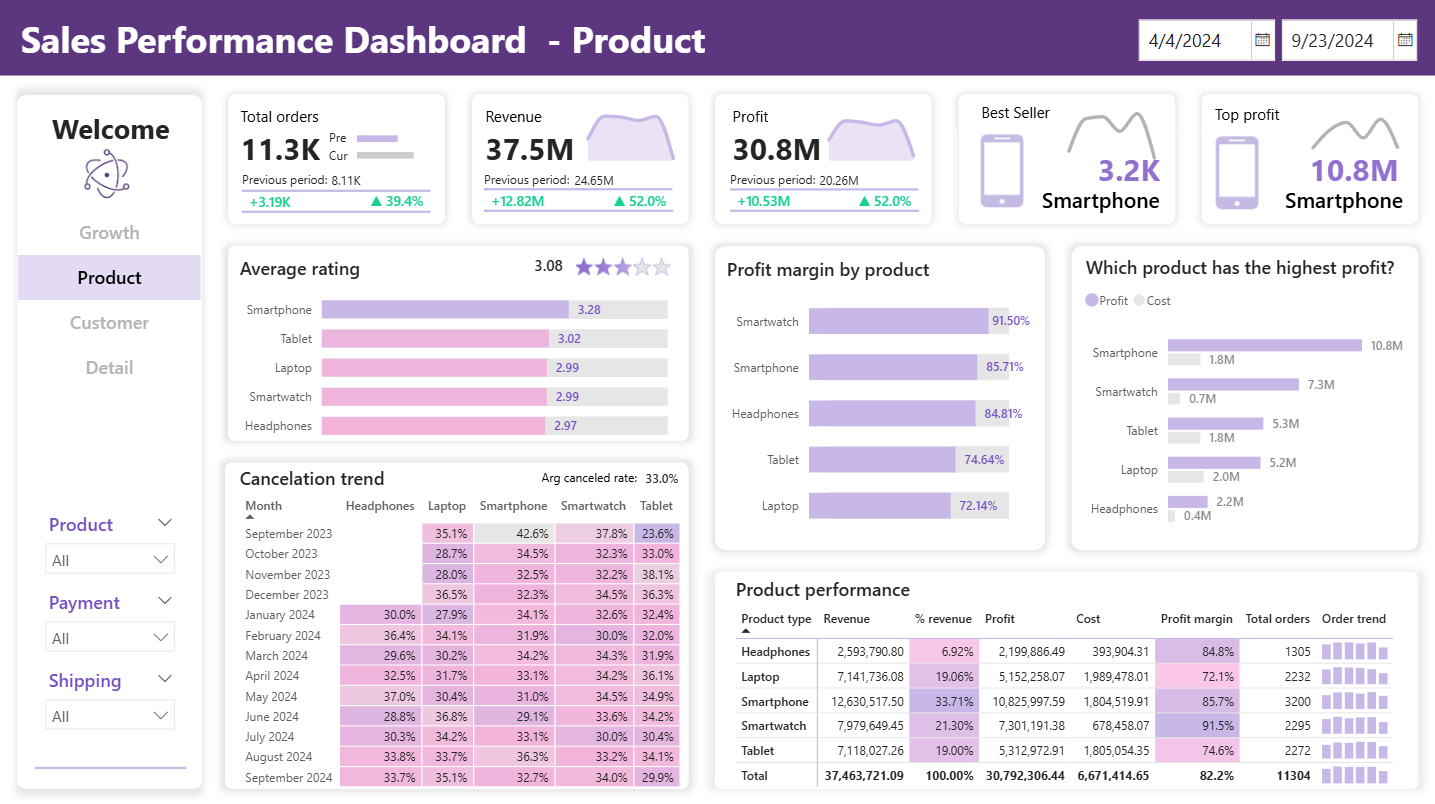
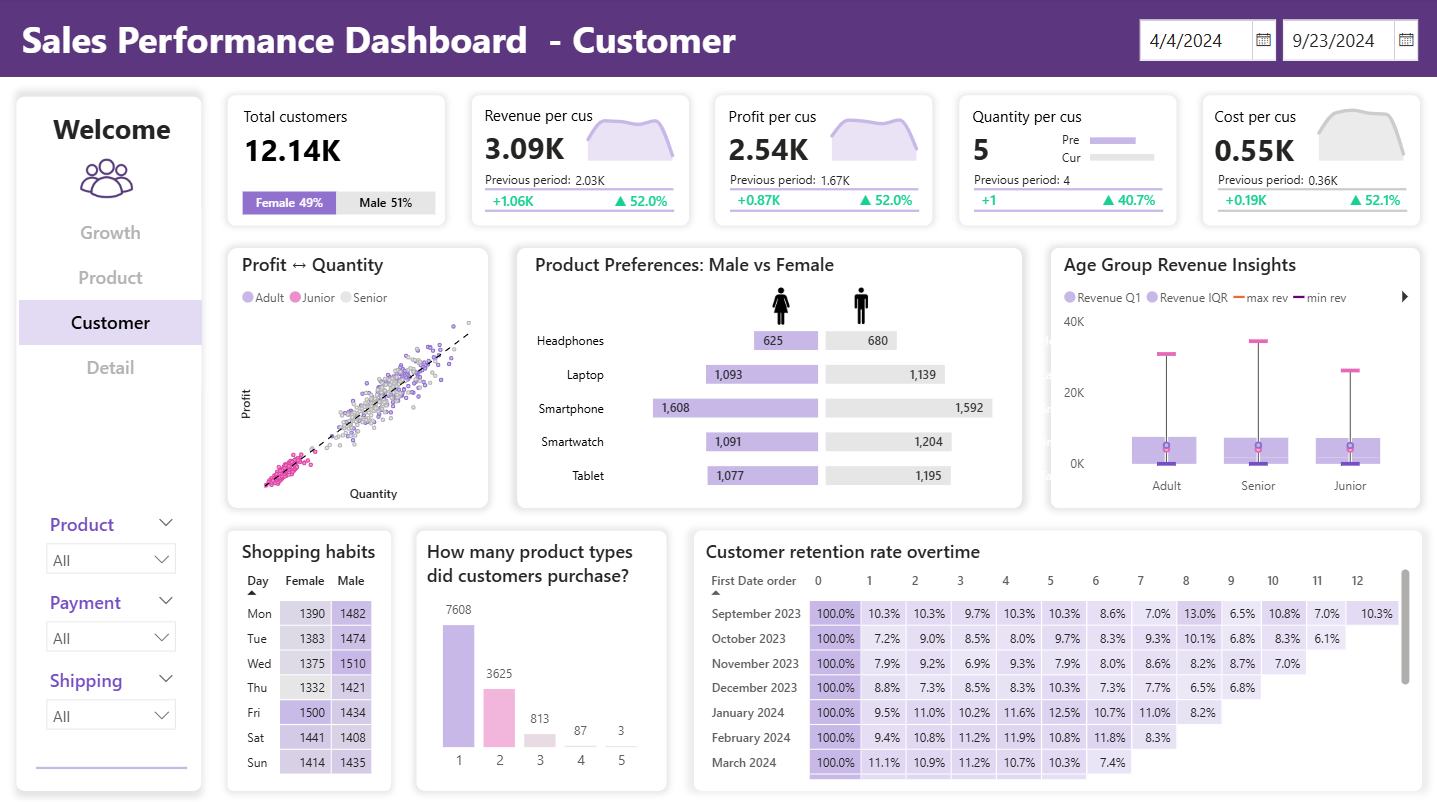
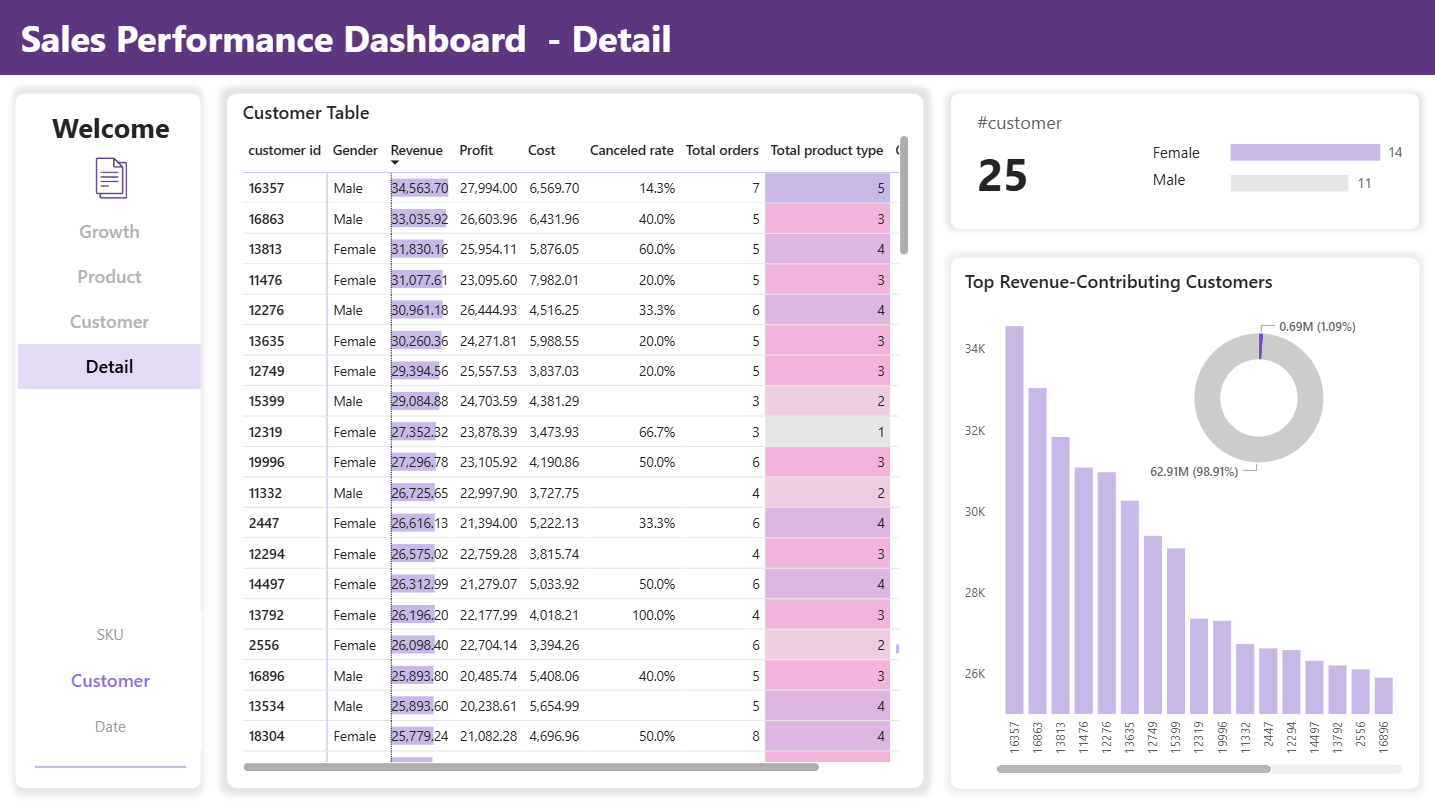
The project presents a sales performance dashboard built with Power BI to explore business trends and customer behavior. It provides a holistic view of sales performance across products, customer segments, and time periods. The dashboard uncovers insights related to growth, loyalty, and operational efficiency. Interactive visualizations support deeper exploration and faster decision-making. The analysis helps optimize strategies and improve overall business outcomes.
Skills Applied:
-
Define sales performance metrics focusing on growth, retention, and product effectiveness.
-
Connect & transform sales datasets for product, customer, and time-based analysis.
-
Analyze & visualize trends in Power BI with filtering and drill-down capabilities.
-
Publish dashboards to enable strategy optimization and faster decision-making.
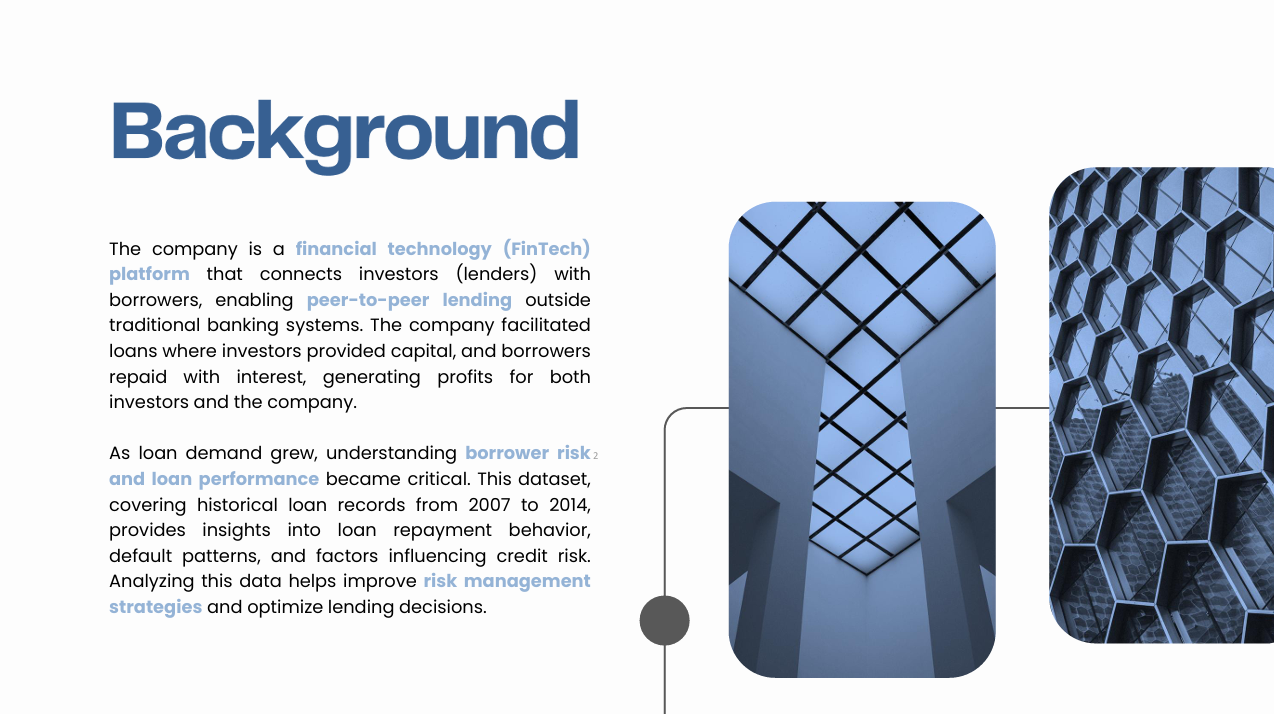
Project 2: Credit Risk Analysis
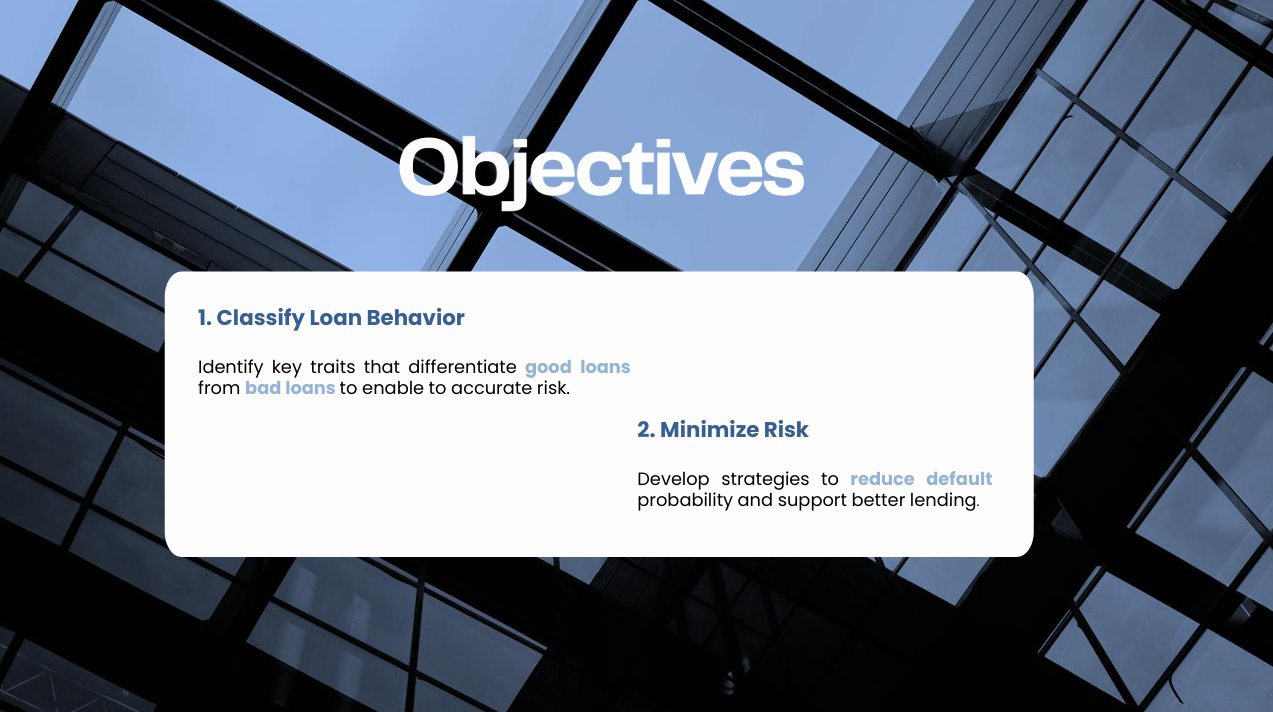
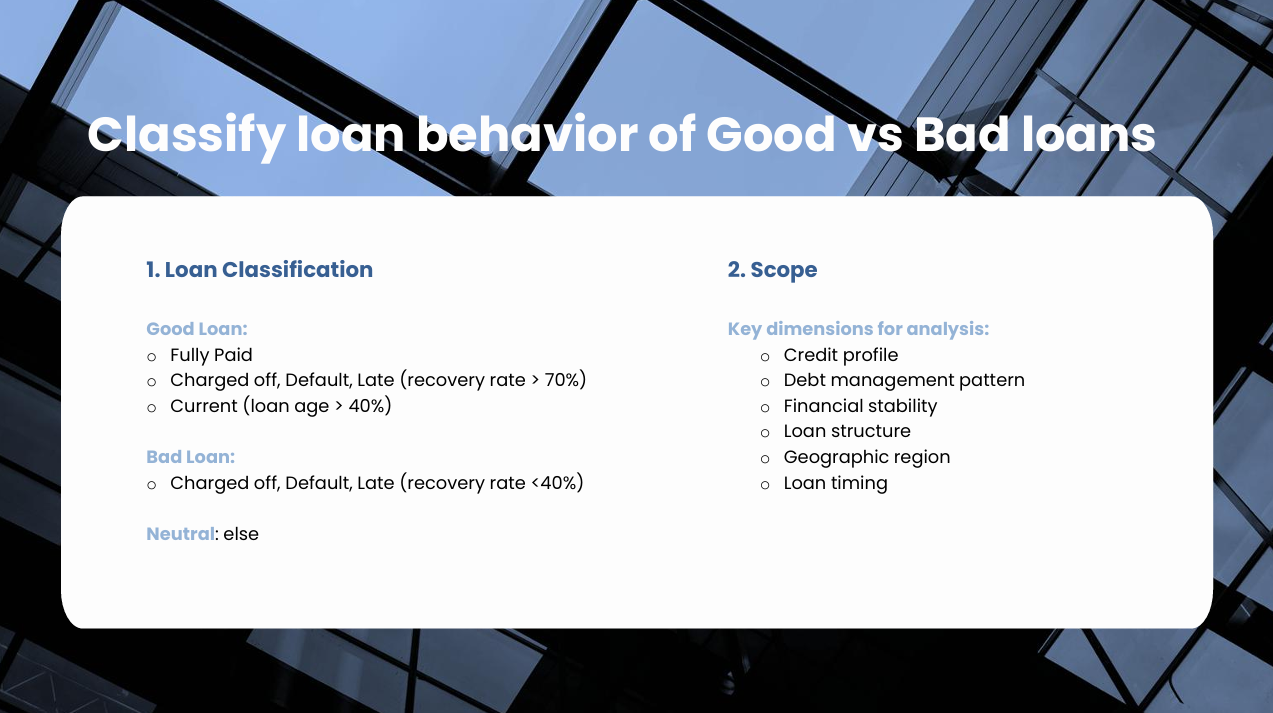
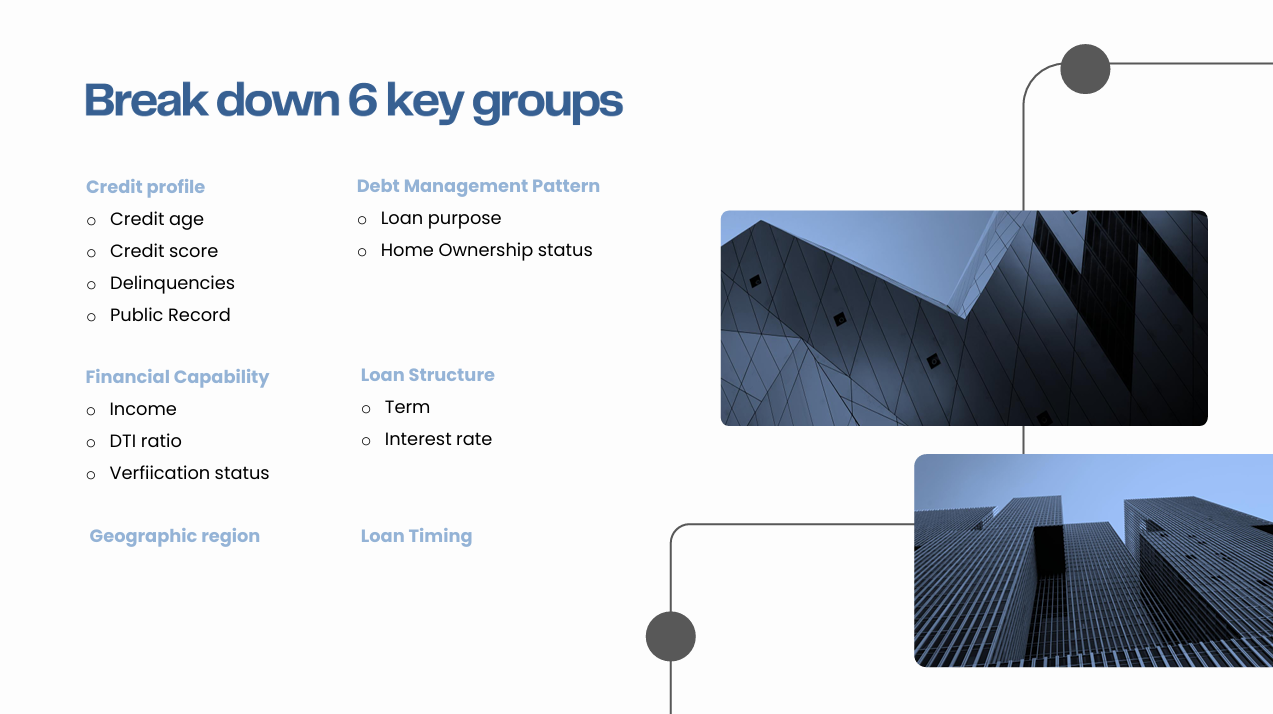
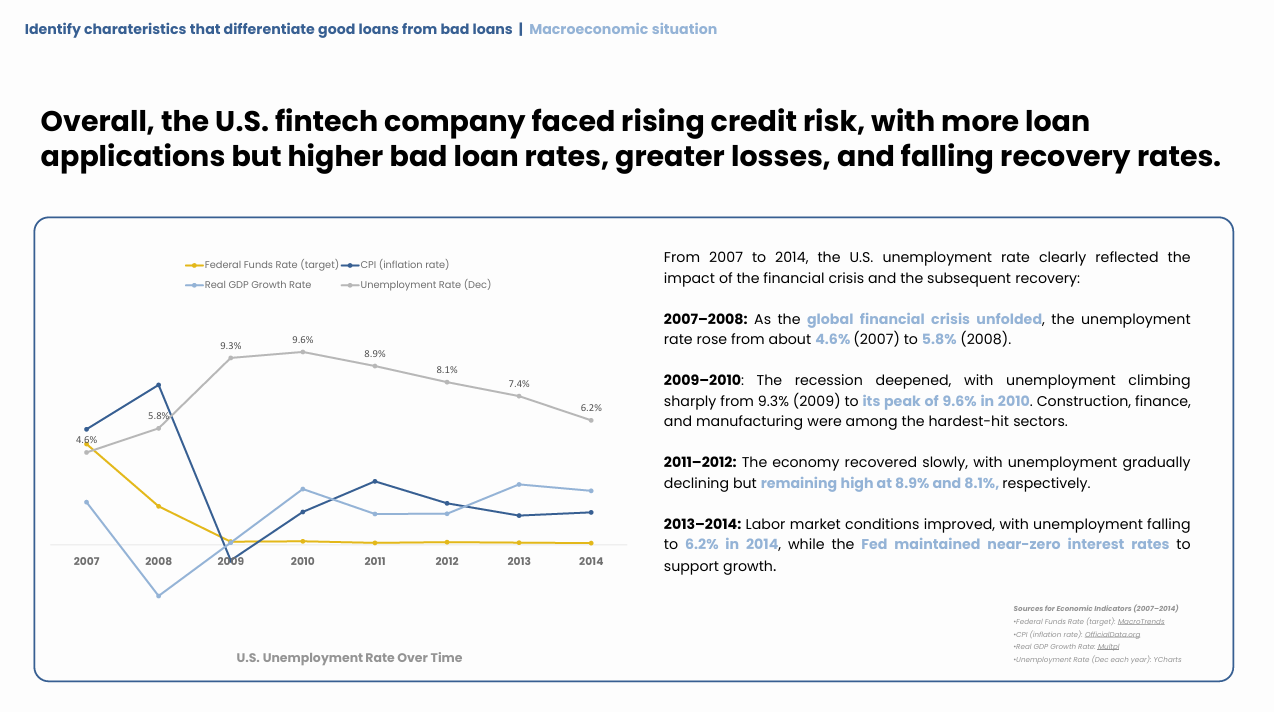
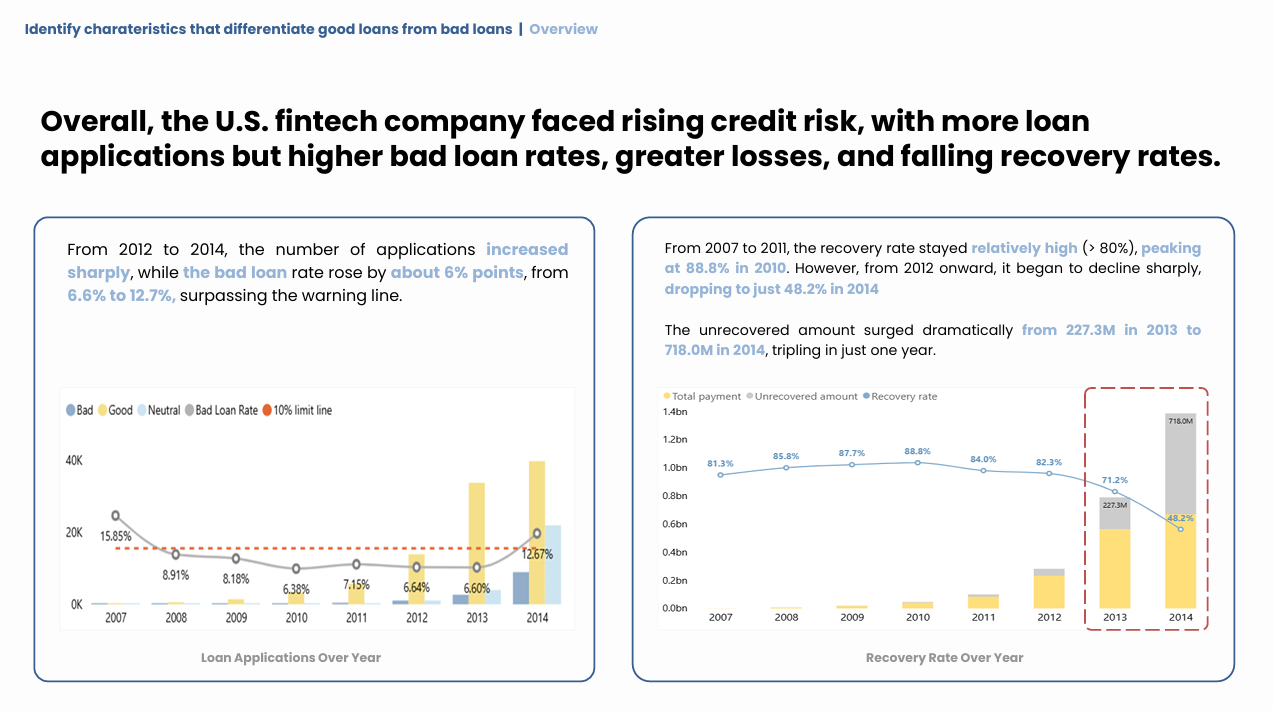
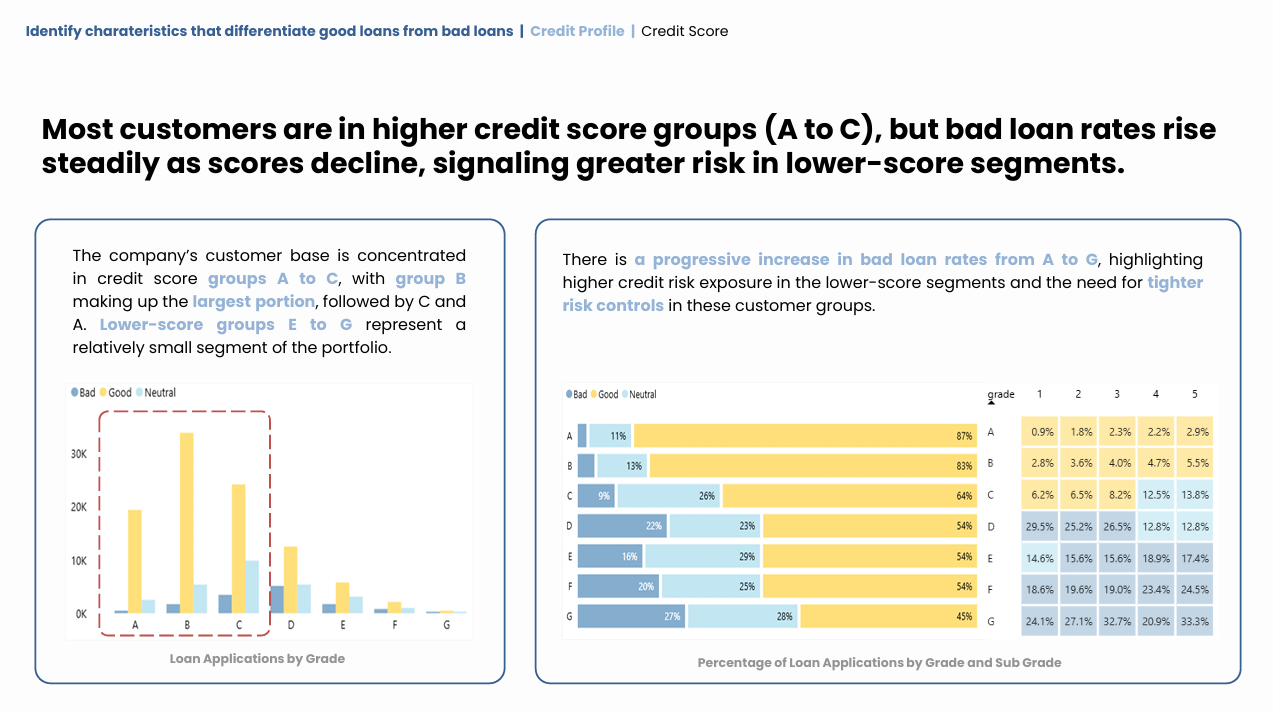
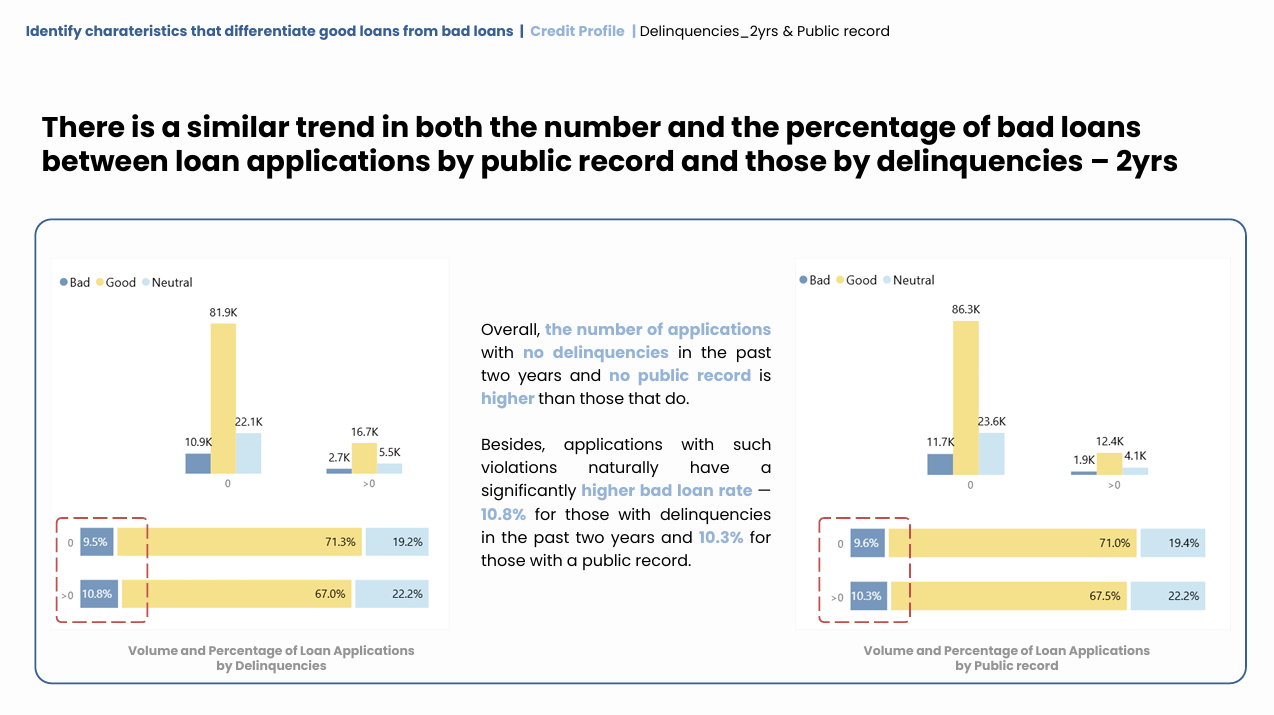
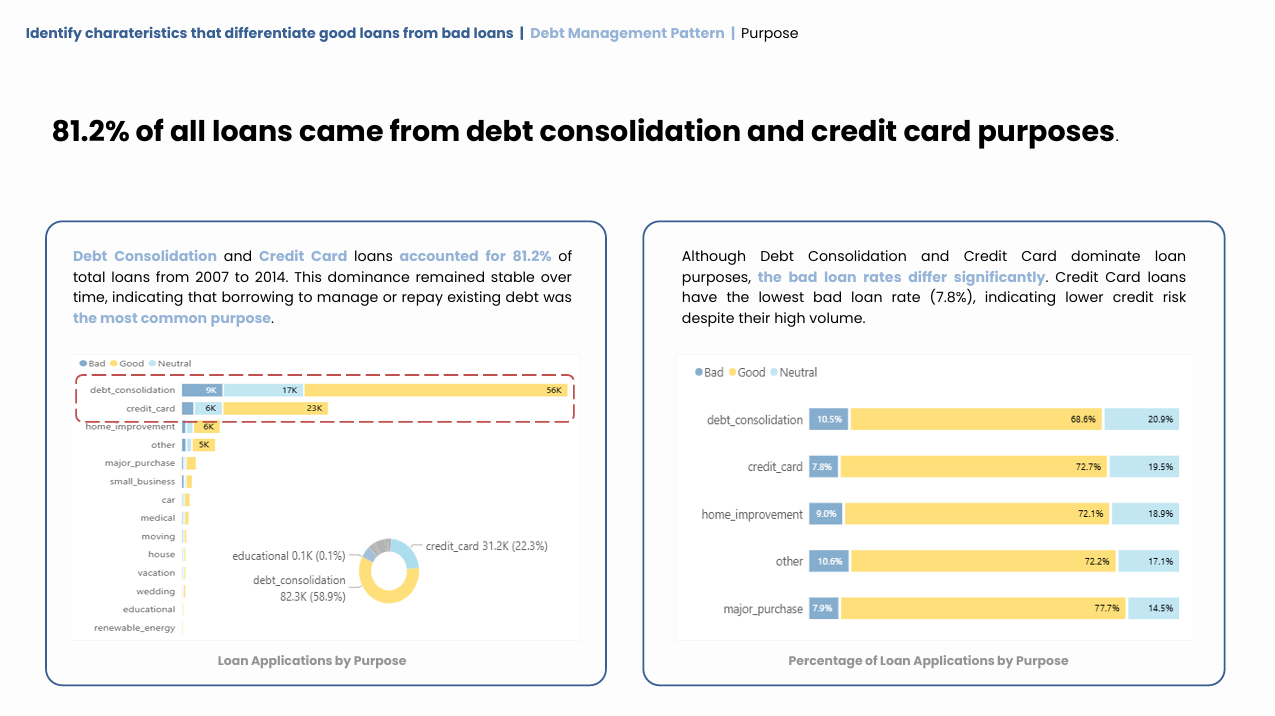
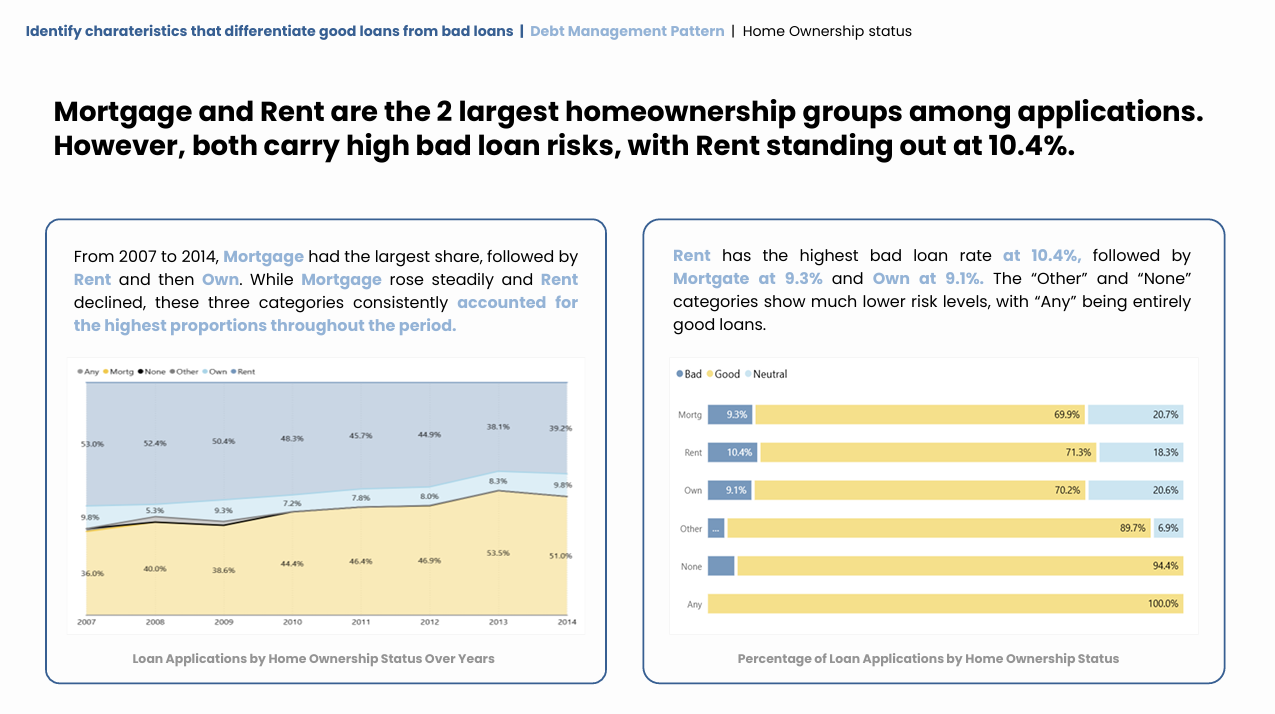
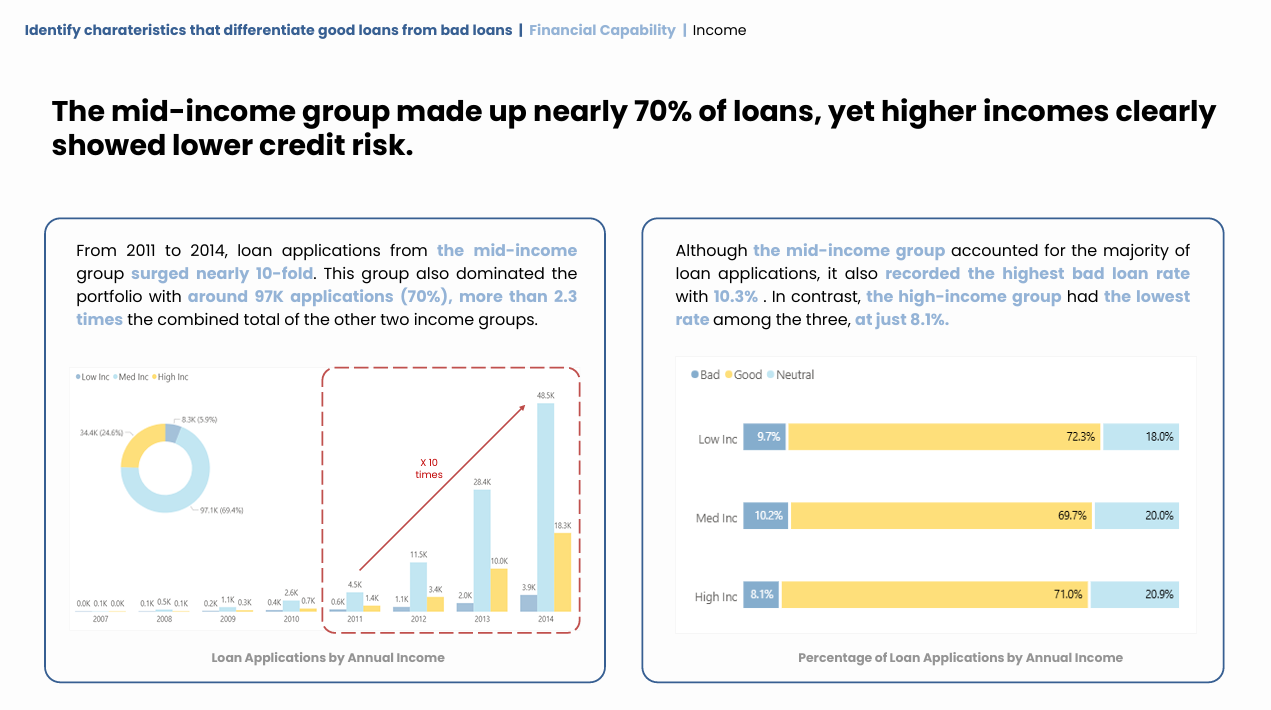
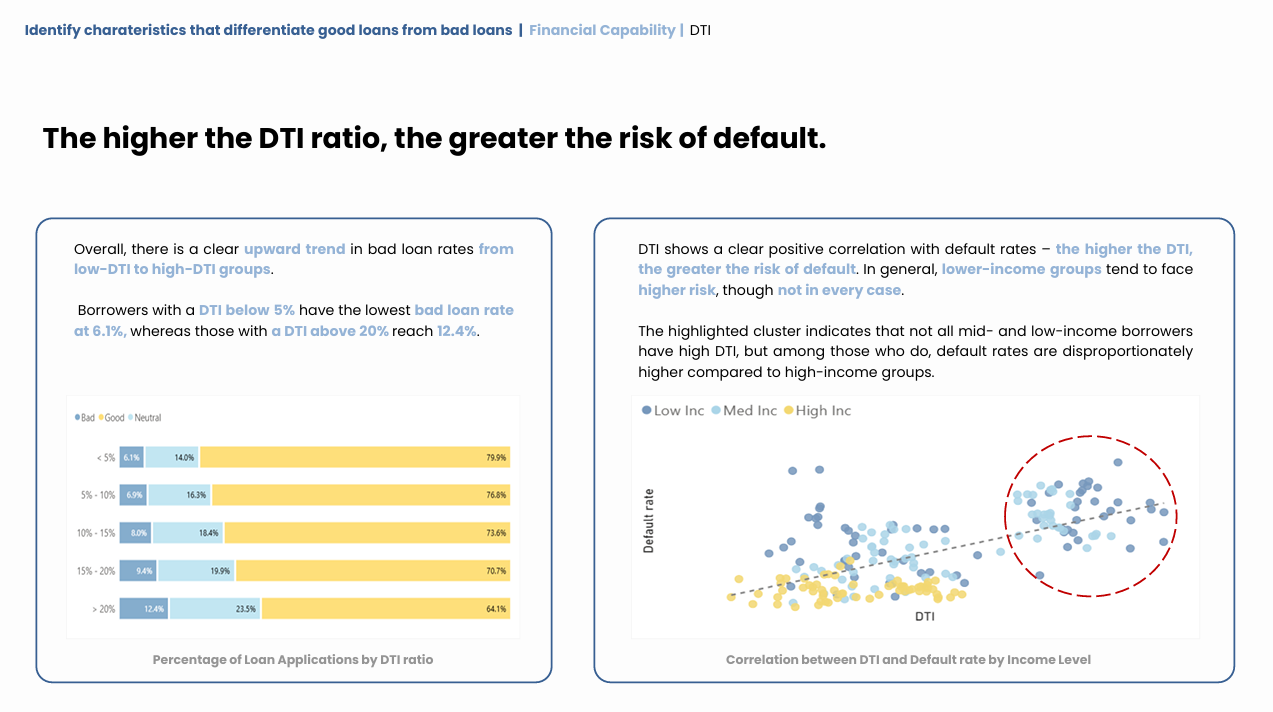
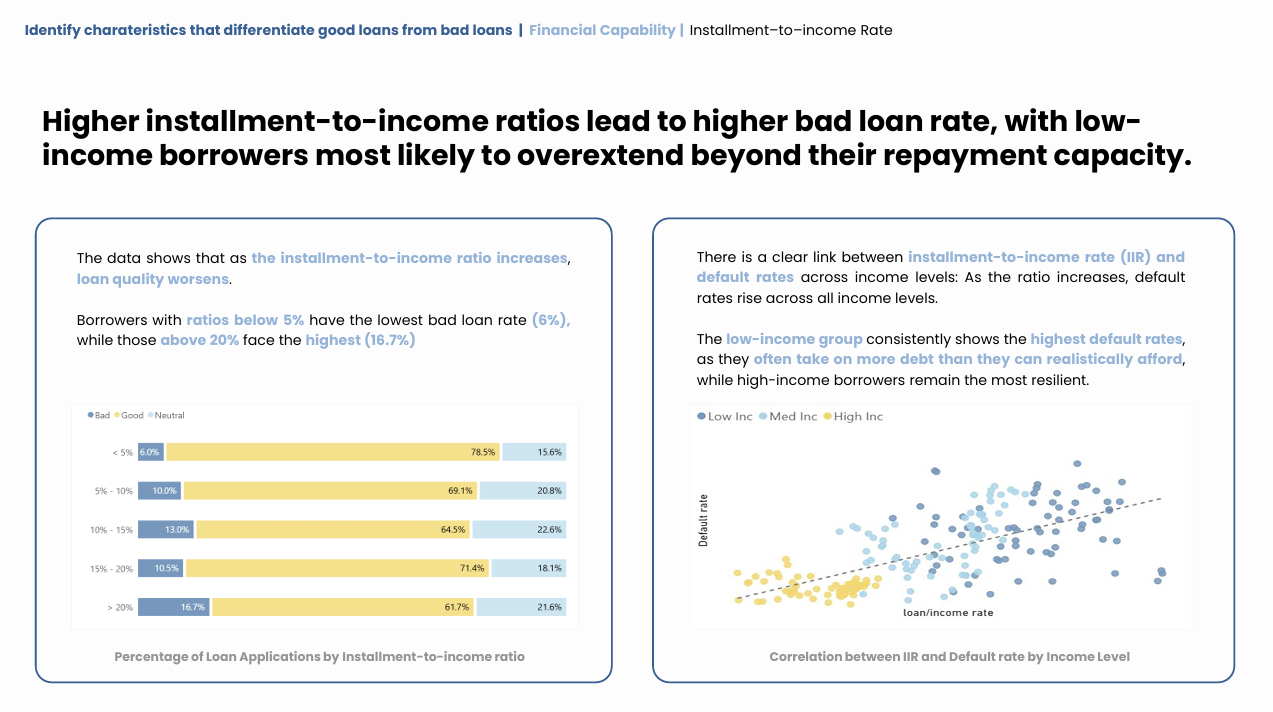
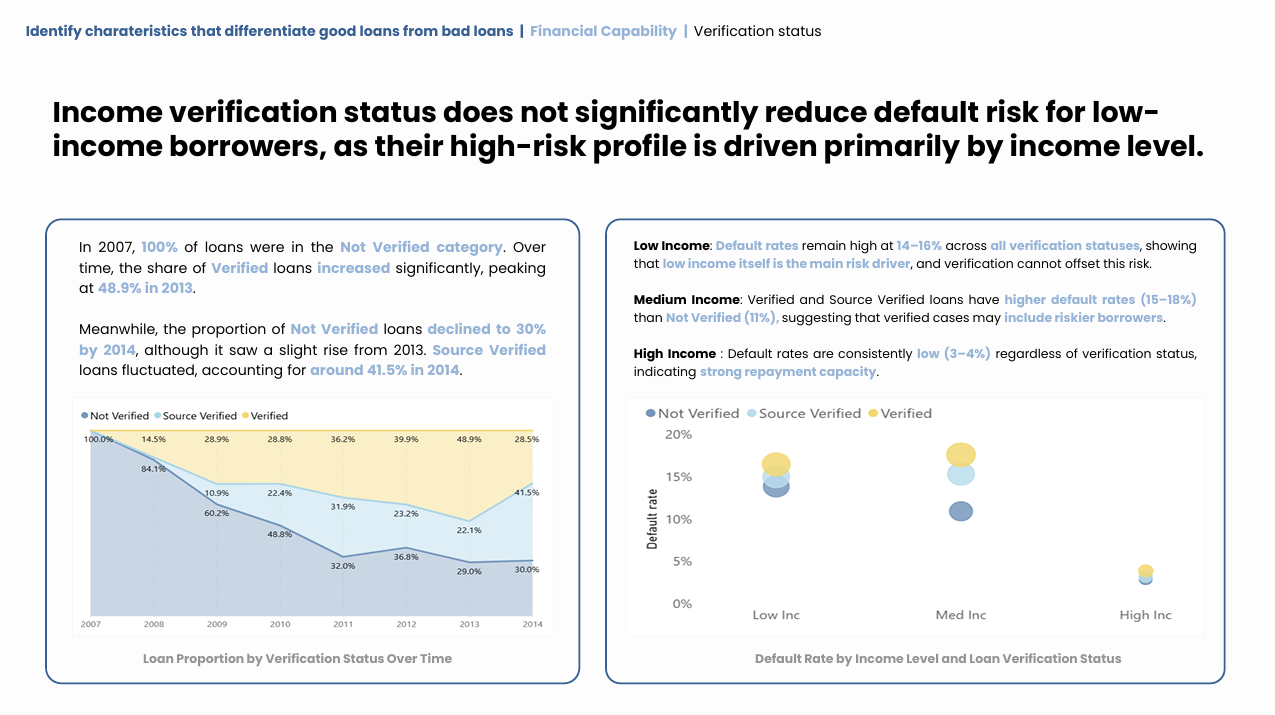
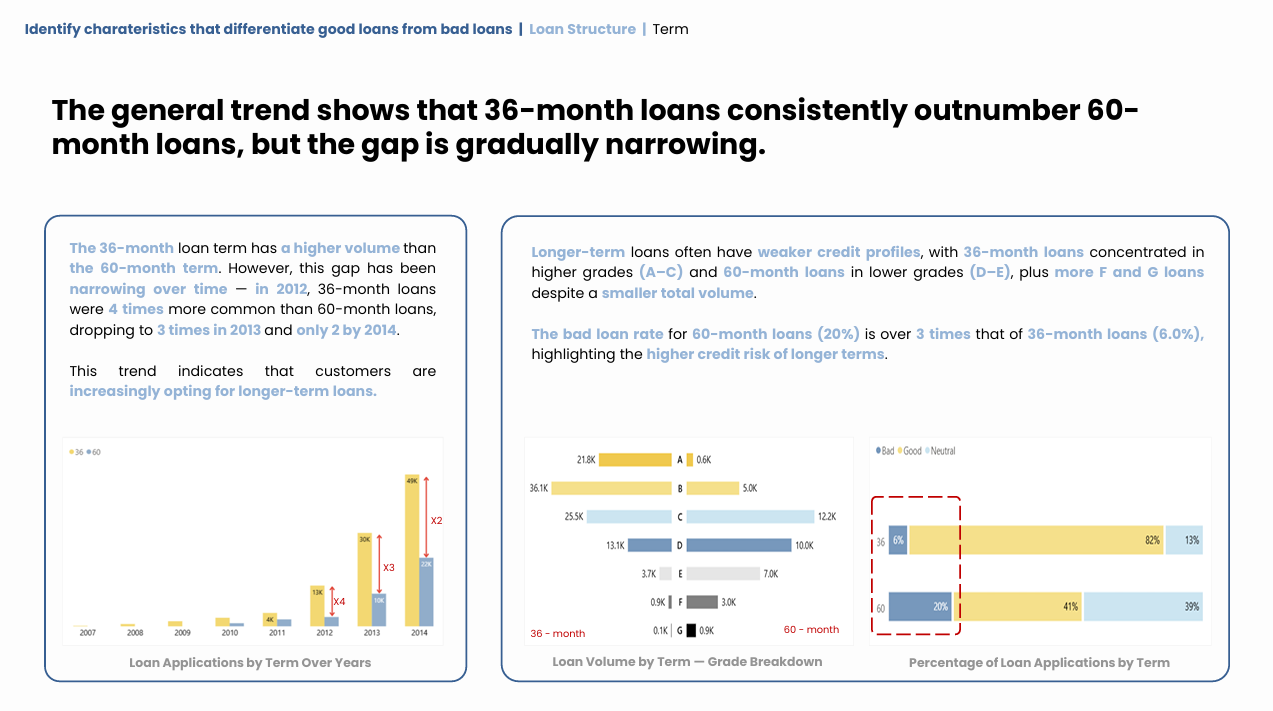
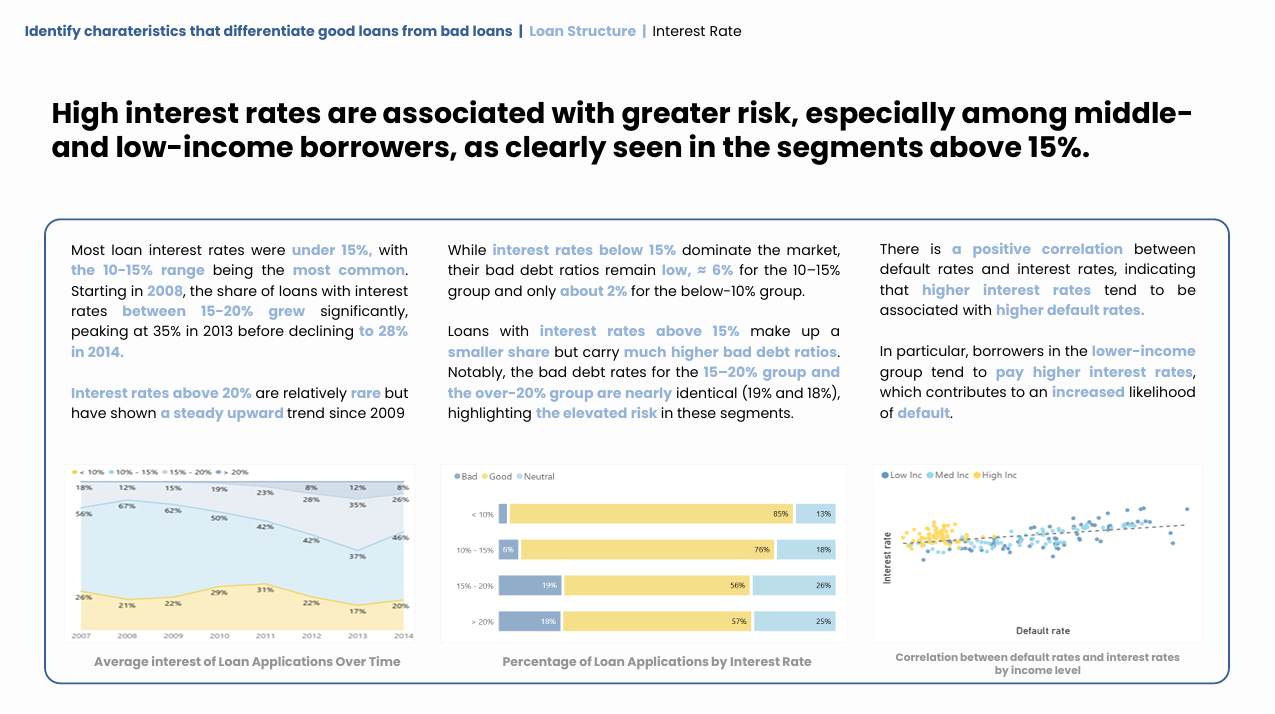
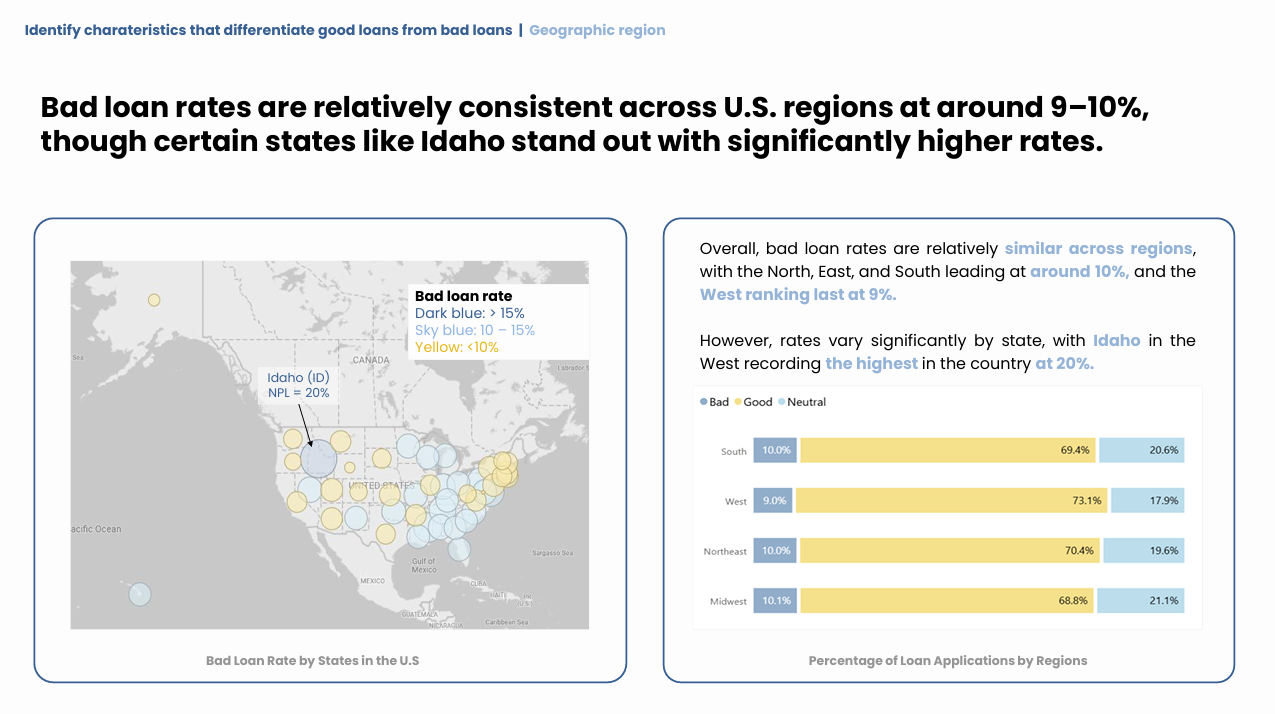
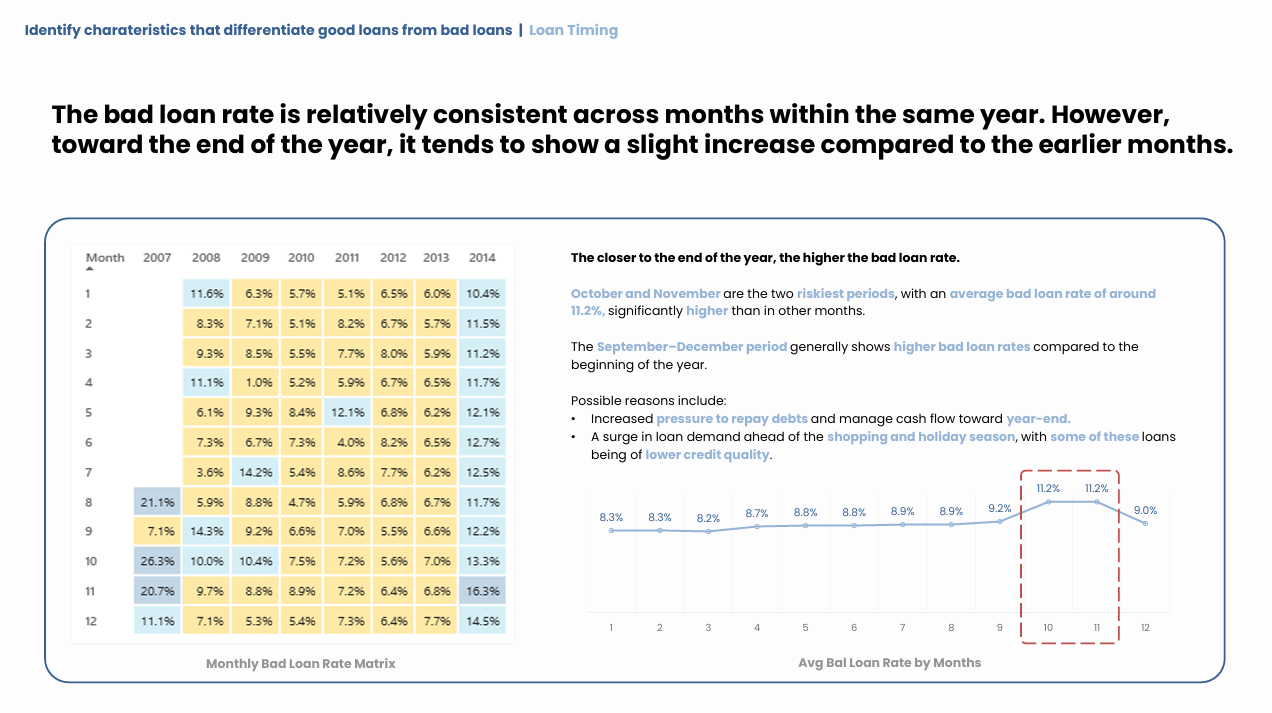
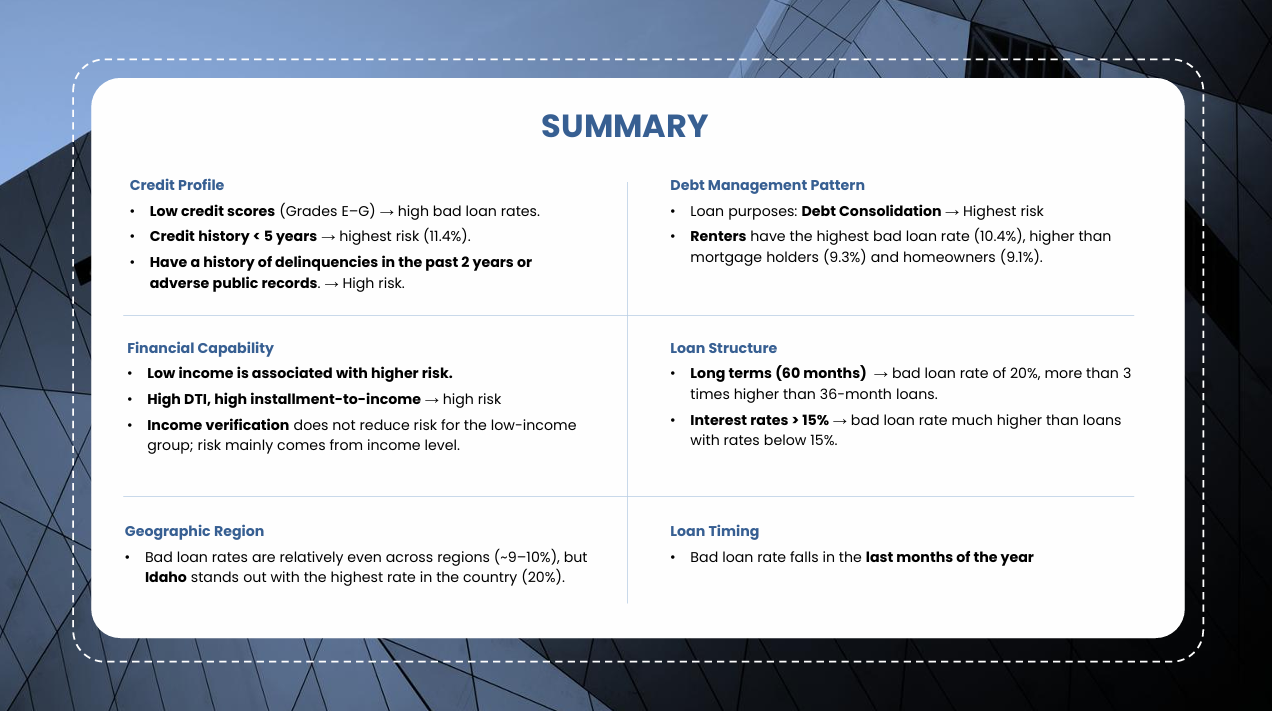
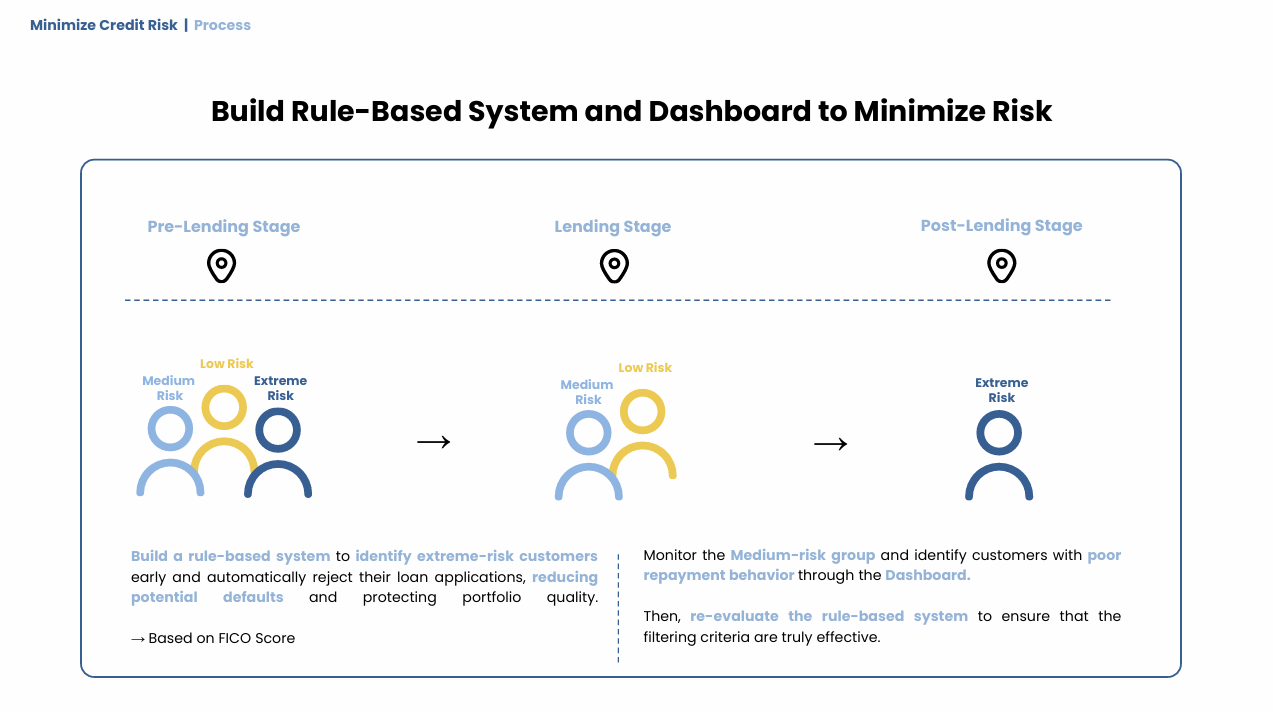
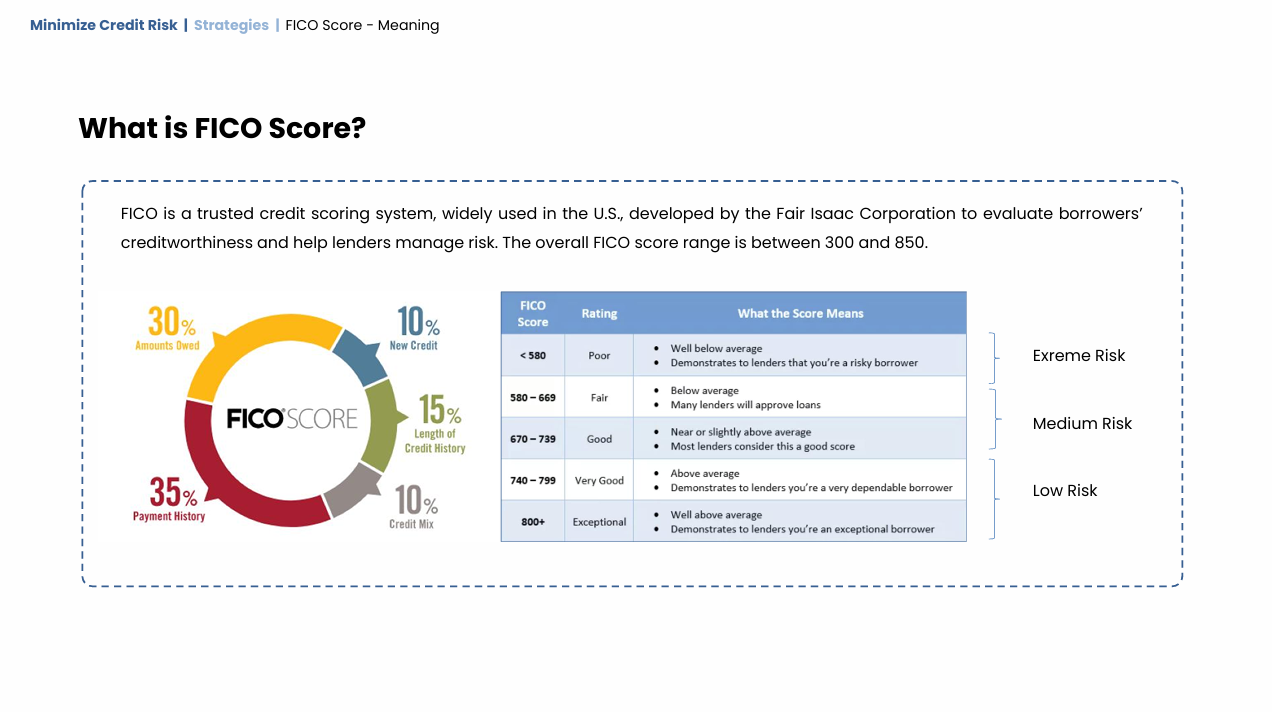
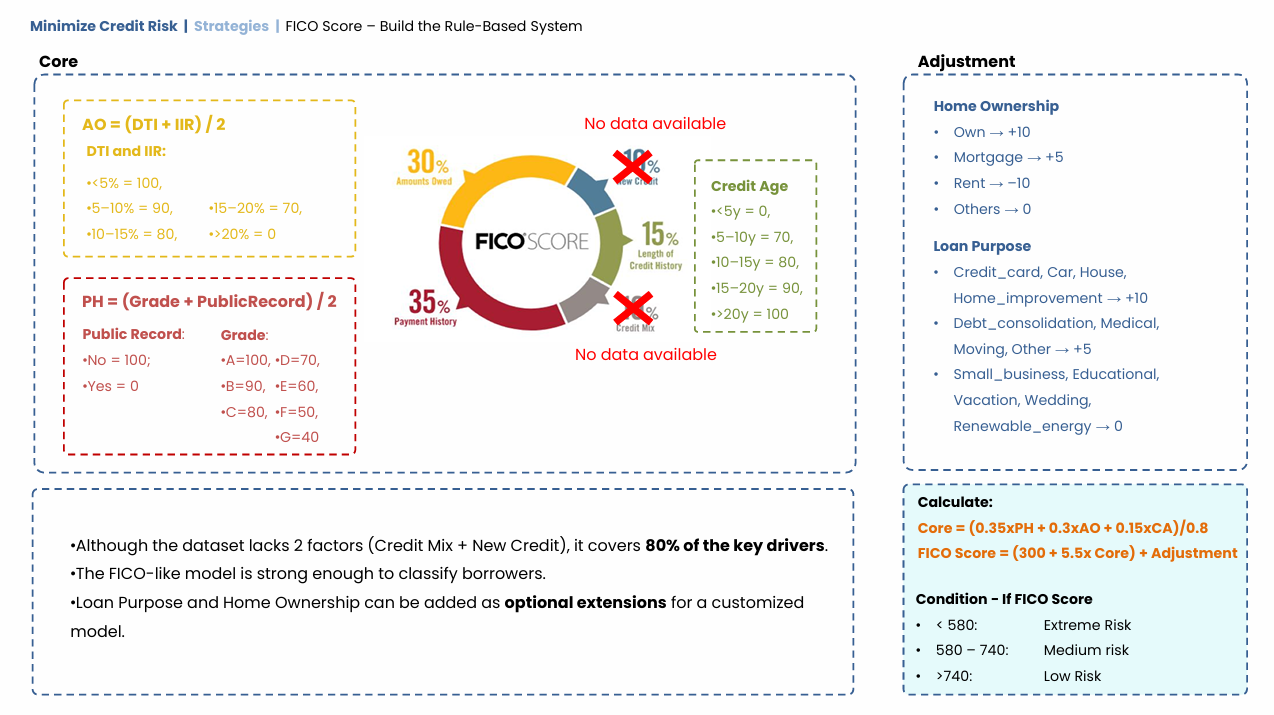
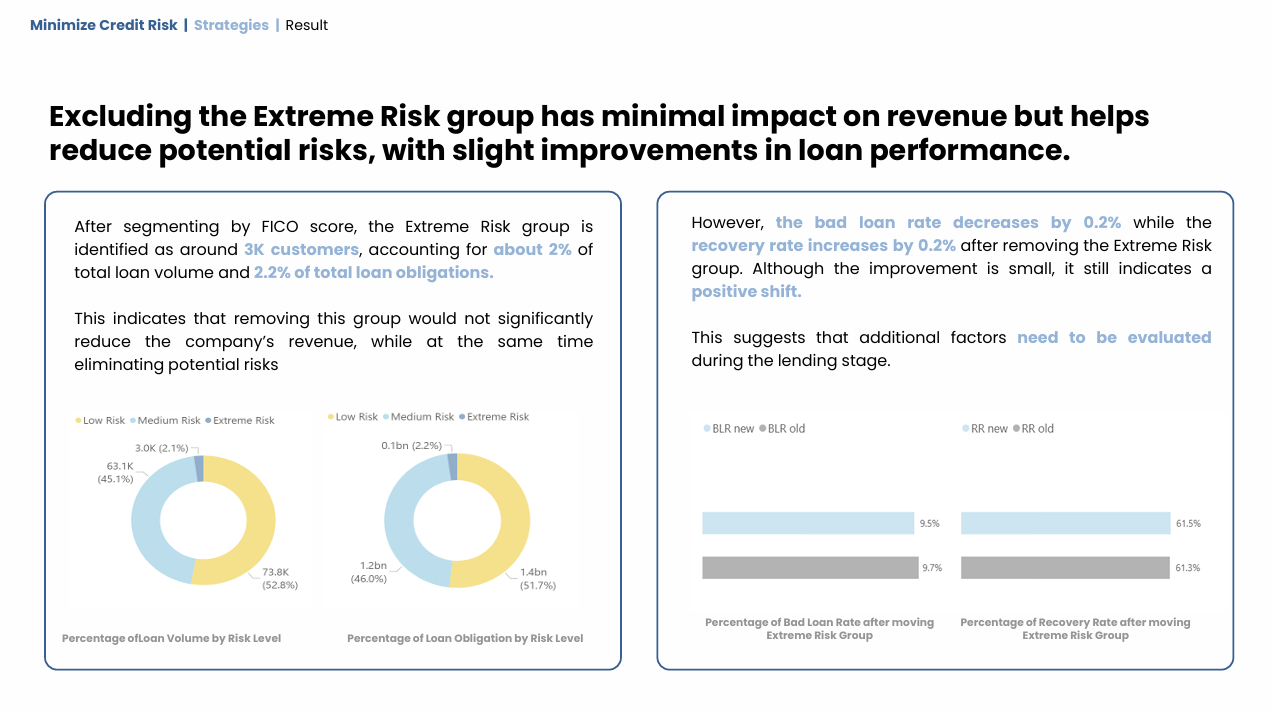
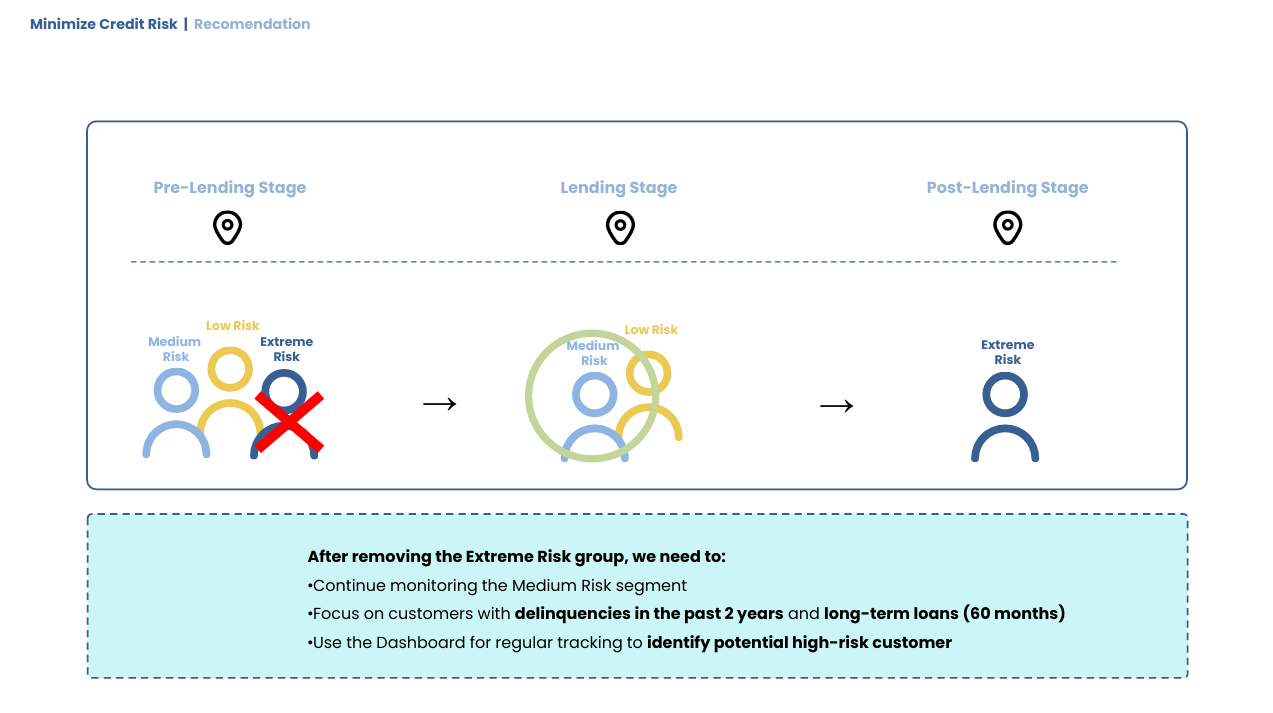
The project focused on analyzing credit risk in a peer-to-peer lending platform using historical loan data from 2007 to 2014. In response to the post-crisis surge in loan applications, using Power BI explores loan records and identifies behavioral patterns that distinguish good loans from bad ones based on credit profile, debt management pattern, financial capability and loan structure. The goal was to provide data-driven insights and recommendations to help reduce default risk and improve lending strategies through better borrower segmentation and risk monitoring.
Skills Applied:
-
Define credit risk objectives & metrics (default rate, recovery rate, credit grade) to evaluate loan portfolio quality.
-
Connect, clean & transform large loan datasets for accurate risk analysis.
-
Analyze & visualize borrower risk patterns in Power BI by credit profile, DTI, term, interest rate, and income.
-
Publish interactive dashboards for risk teams to monitor and act on emerging issues.
-
Create presentation slides & apply storytelling to communicate findings and recommendations effectively.