
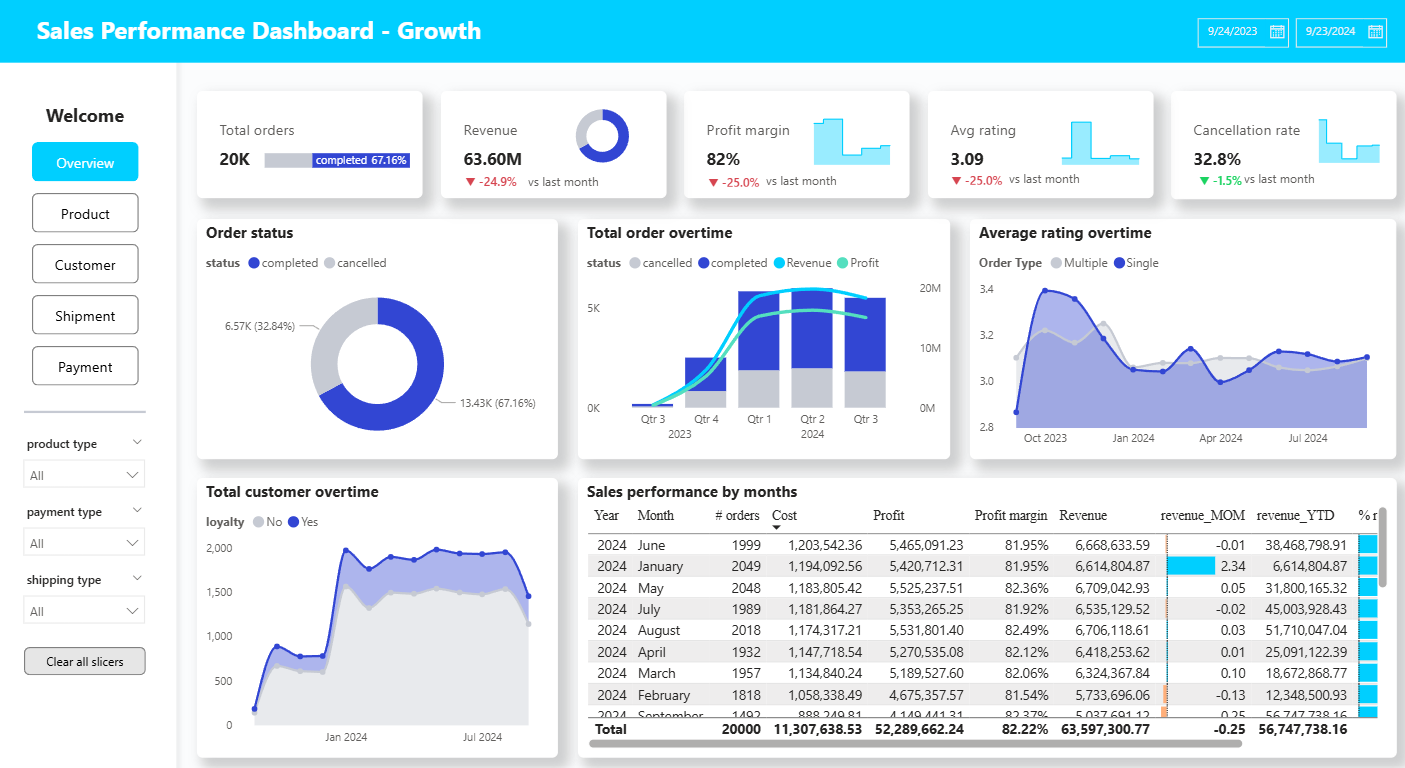
Project 1: Sales Performance Dashboard
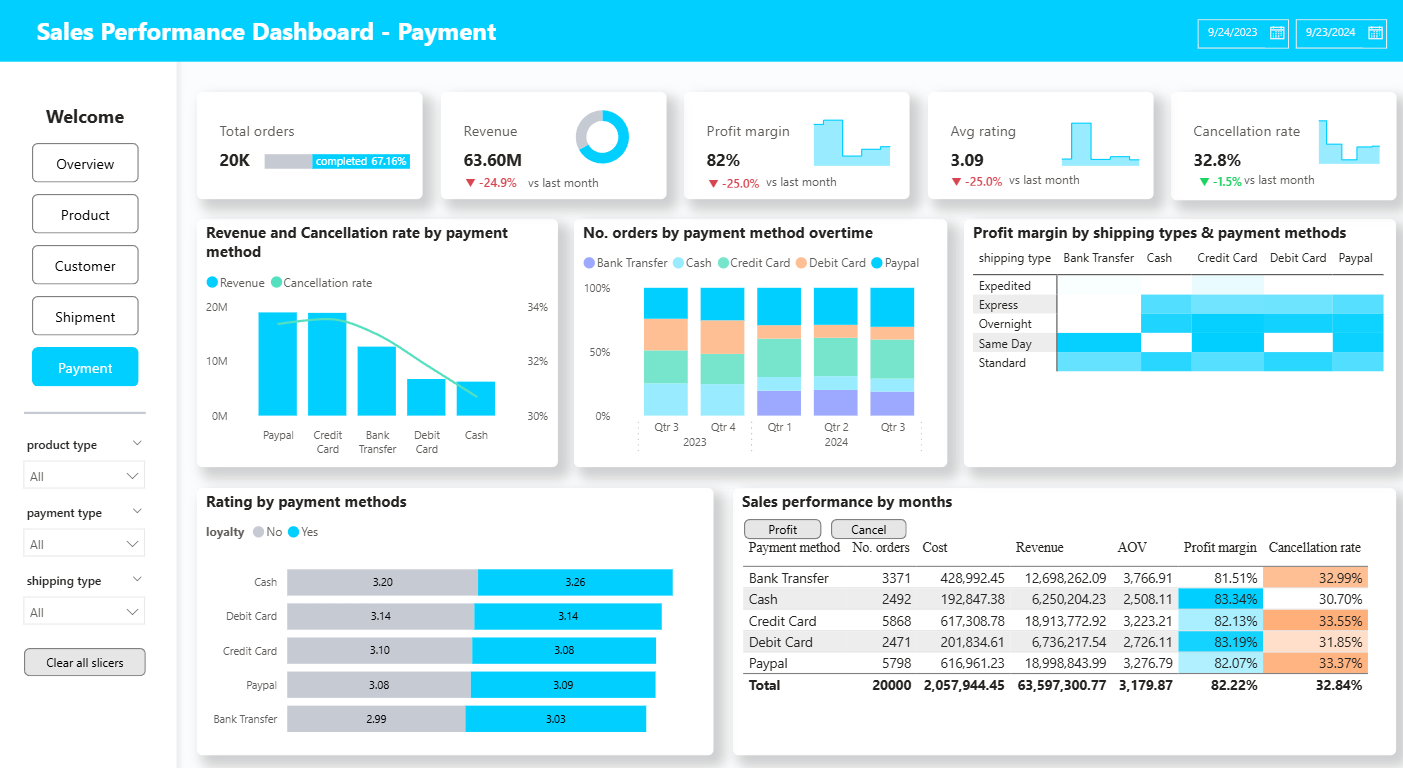
The project presents a sales performance dashboard built with Power BI to explore business trends and customer behavior. It provides a holistic view of sales performance across products, customer segments, and time periods. The dashboard uncovers insights related to growth, loyalty, and operational efficiency. Interactive visualizations support deeper exploration and faster decision-making. The analysis helps optimize strategies and improve overall business outcomes.
Skills Applied:
-
Define sales performance metrics focusing on growth, retention, and product effectiveness.
-
Connect & transform sales datasets for product, customer, and time-based analysis.
-
Analyze & visualize trends in Power BI with filtering and drill-down capabilities.
-
Publish dashboards to enable strategy optimization and faster decision-making.
Nâng tầm phân tích – Kết nối dữ liệu – Dẫn đầu quyết định
Khóa học “Master Analytical Thinking & Data Analysis with Power BI” tại MazHocData mang đến tư duy phân tích và kỹ năng Power BI thực chiến, sẵn sàng ứng dụng vào doanh nghiệp thực tế.
Khám phá Power BI thực chiến cùng MazHocData: mazhocdata.com/power-bi
Khám phá Power BI thực chiến cùng MazHocData: mazhocdata.com/power-bi