
Chúc mừng bạn đã hoàn thành khóa học xuất sắc 🎉
Nâng tầm phân tích – Kết nối dữ liệu – Dẫn đầu quyết định
Khóa học "Master Analytical Thinking & Data Analysis with Power BI" tại MazHocData mang đến tư duy phân tích và kỹ năng Power BI thực chiến, sẵn sàng ứng dụng vào doanh nghiệp thực tế.
CRM Dashboard
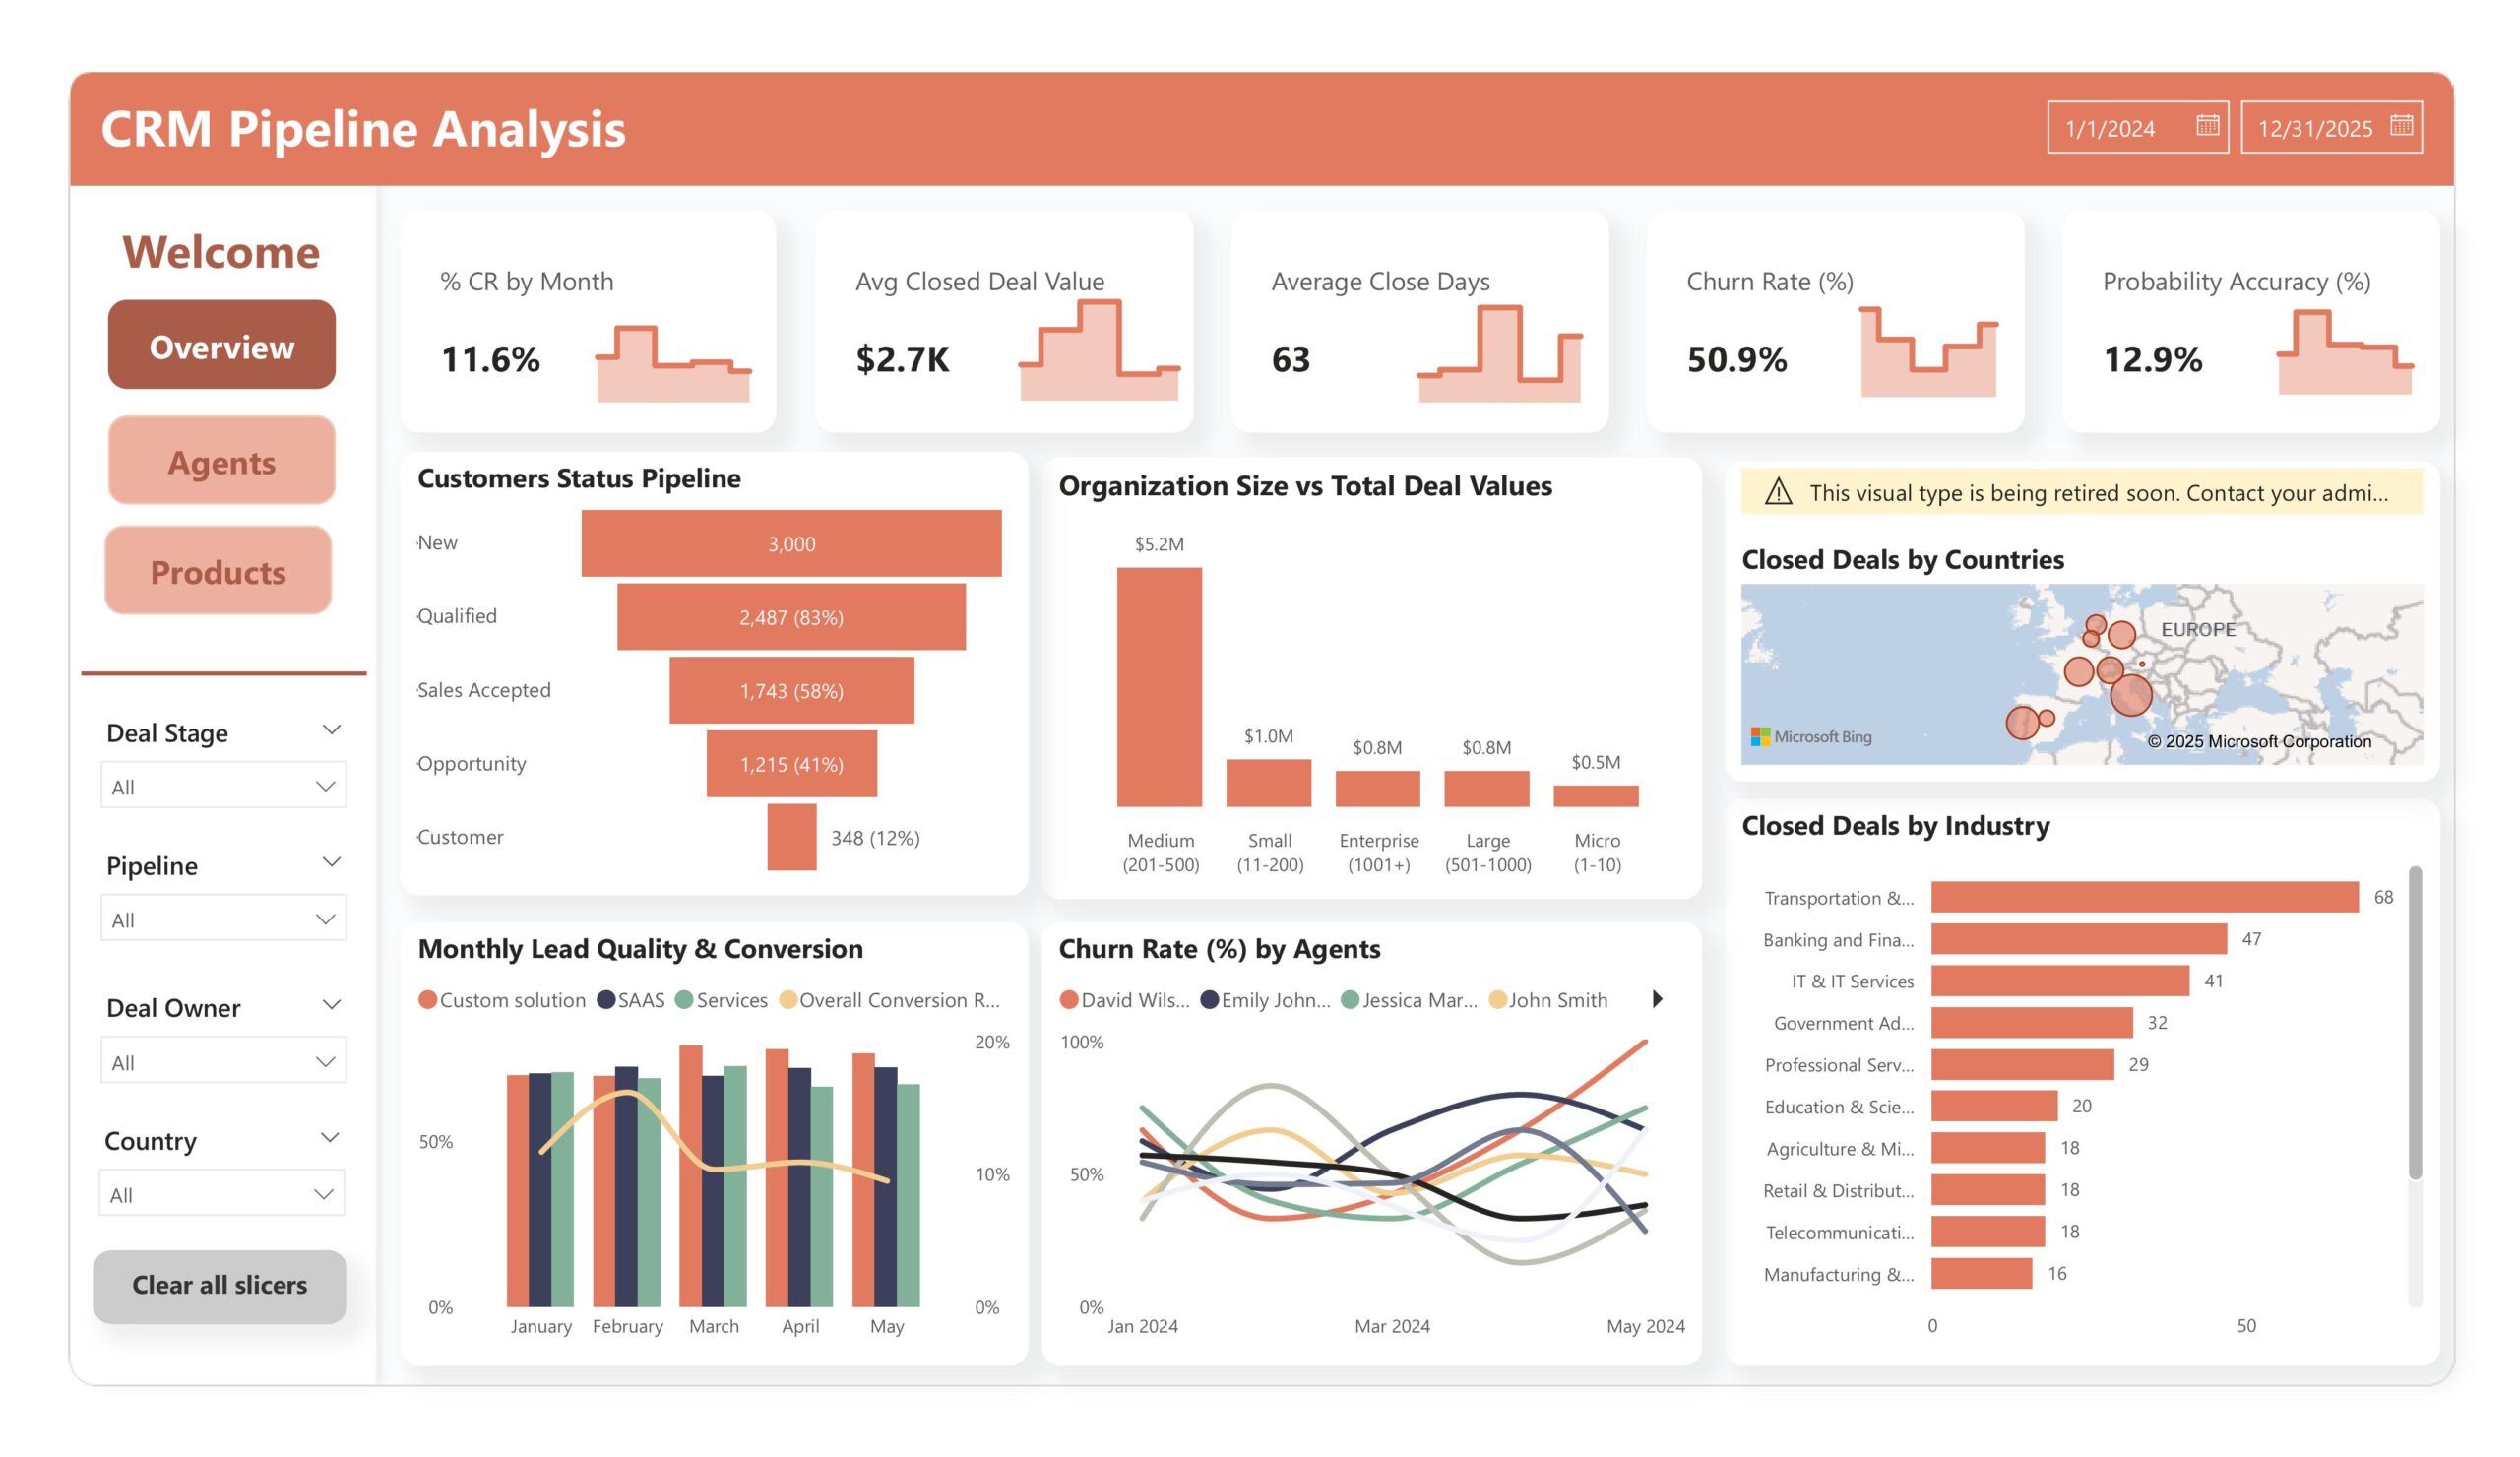
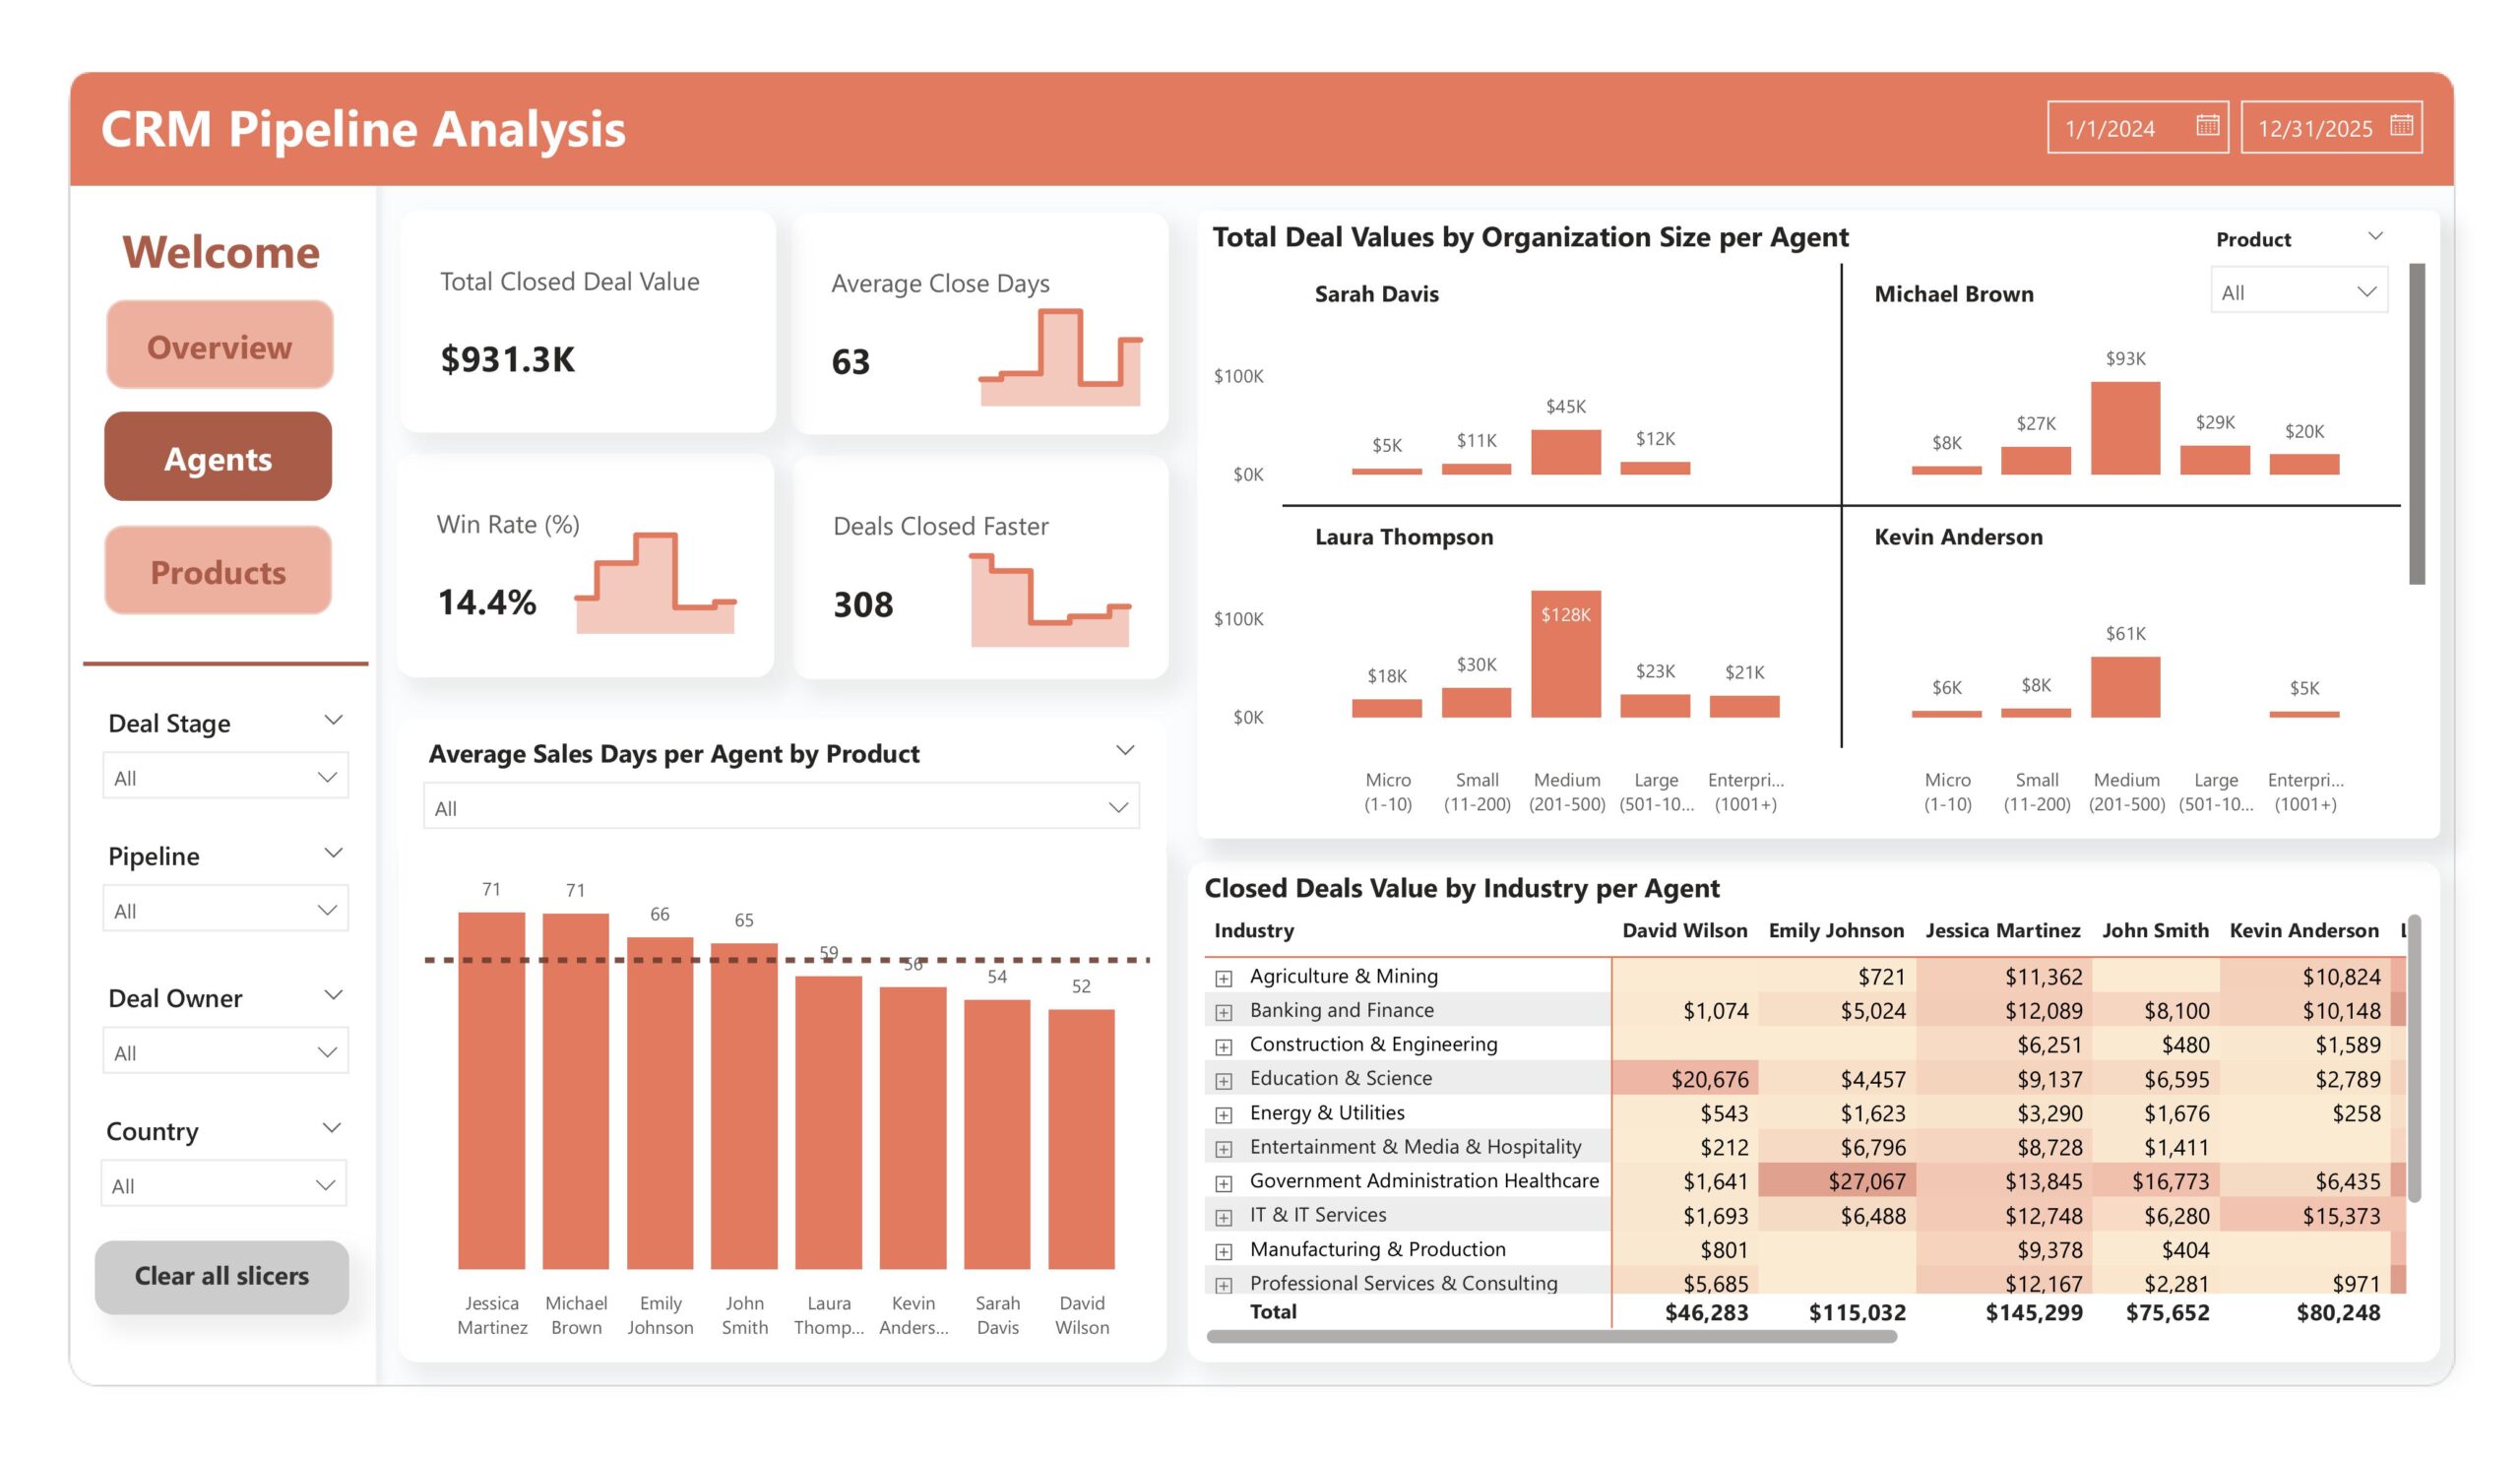
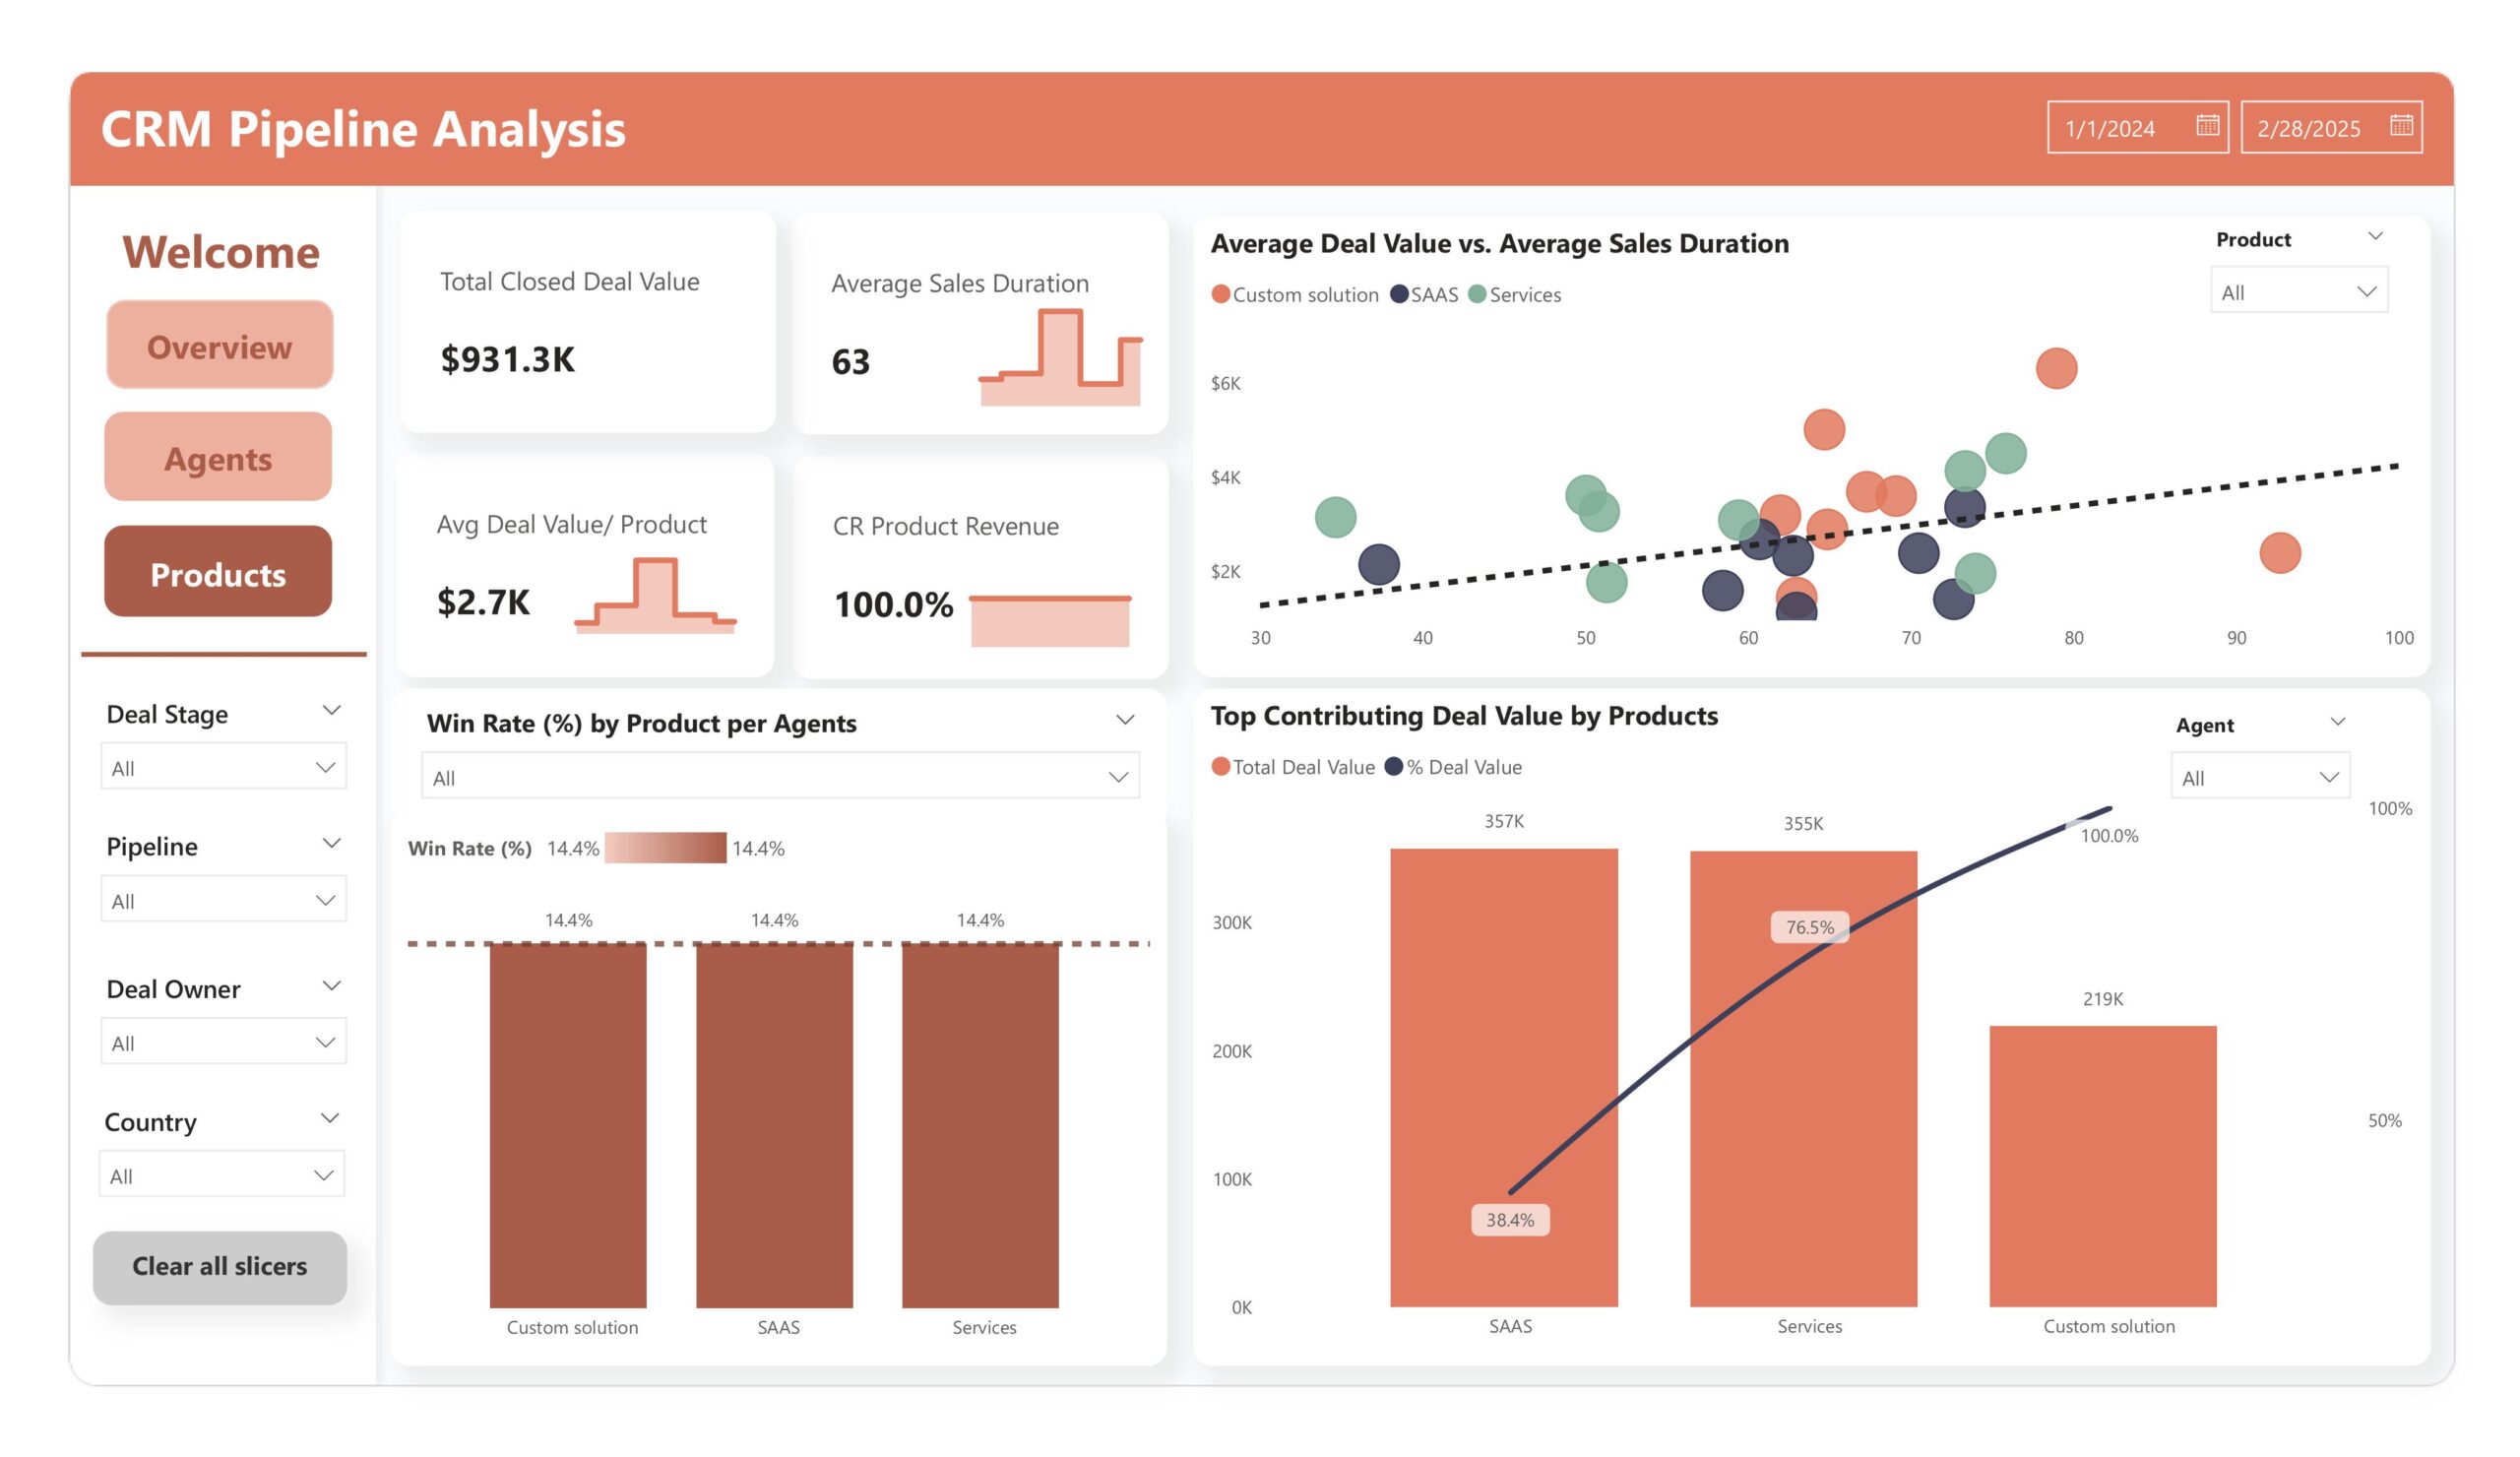
The CRM Sales Analytics dataset contains 3,000 B2B sales records and multiple supporting dimensions, modeling the full sales pipeline from lead acquisition to customer conversion. It captures key attributes such as industry, deal value, sales agent performance, probability scoring, product type, and organization size. Learners can act as CRM/Sales Analysts to evaluate conversion rates, identify high-value segments, assess sales cycle efficiency, analyze agent performance, and uncover churn risks supporting data-driven decisions for improving sales strategy and revenue forecasting.
Skills Applied
Marketing Analysis
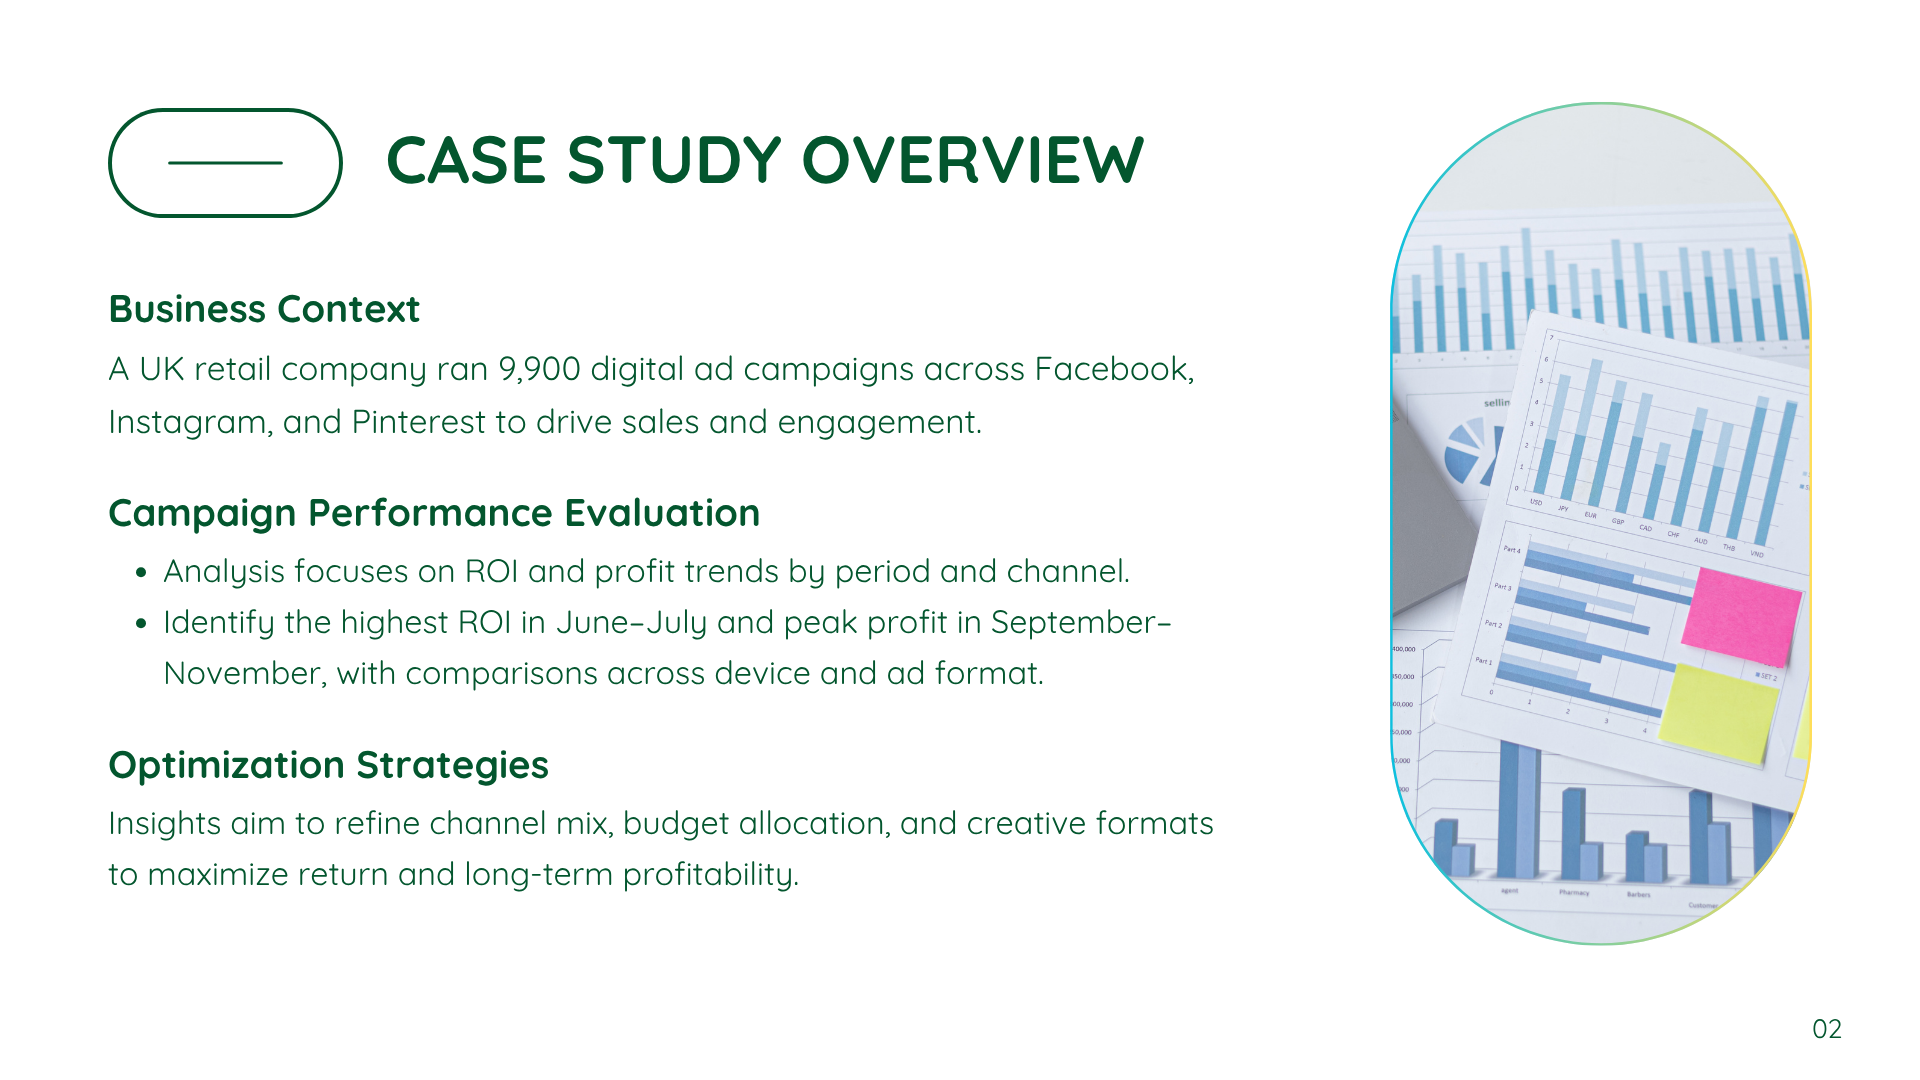
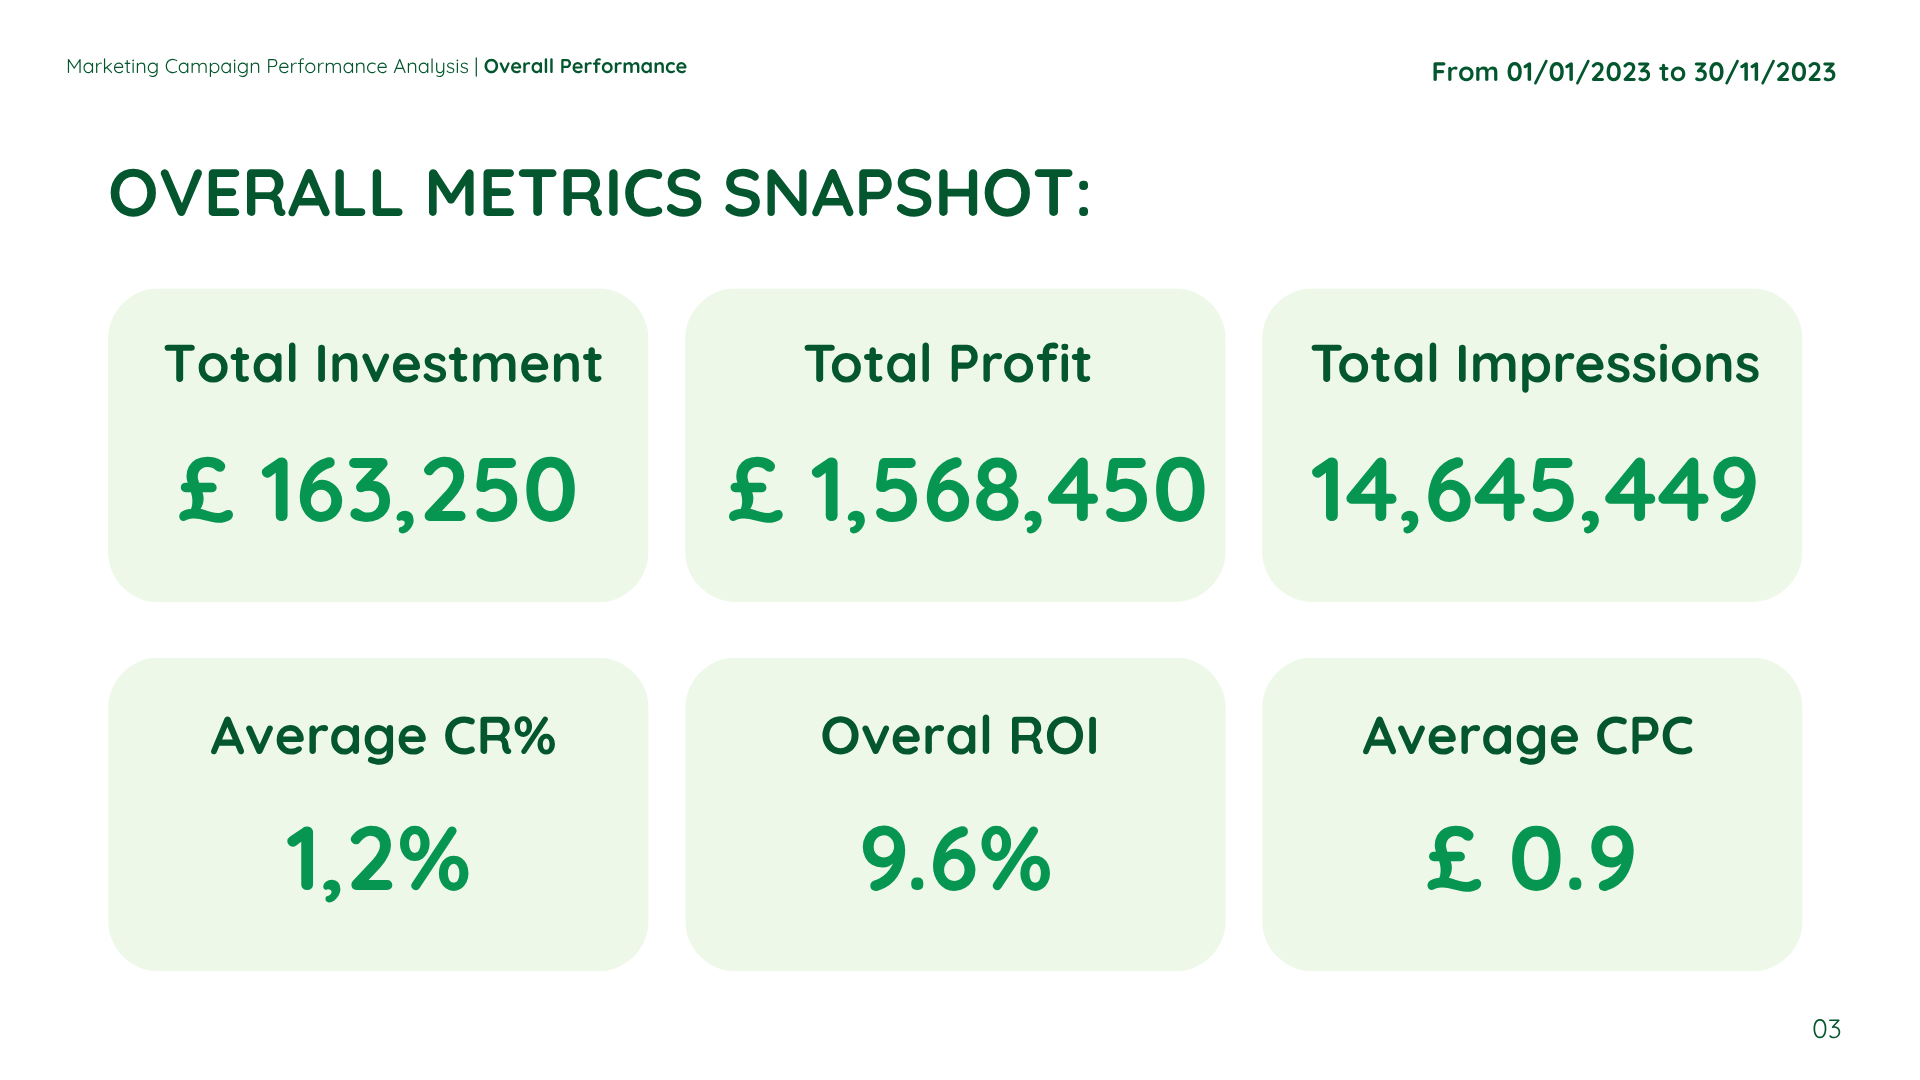
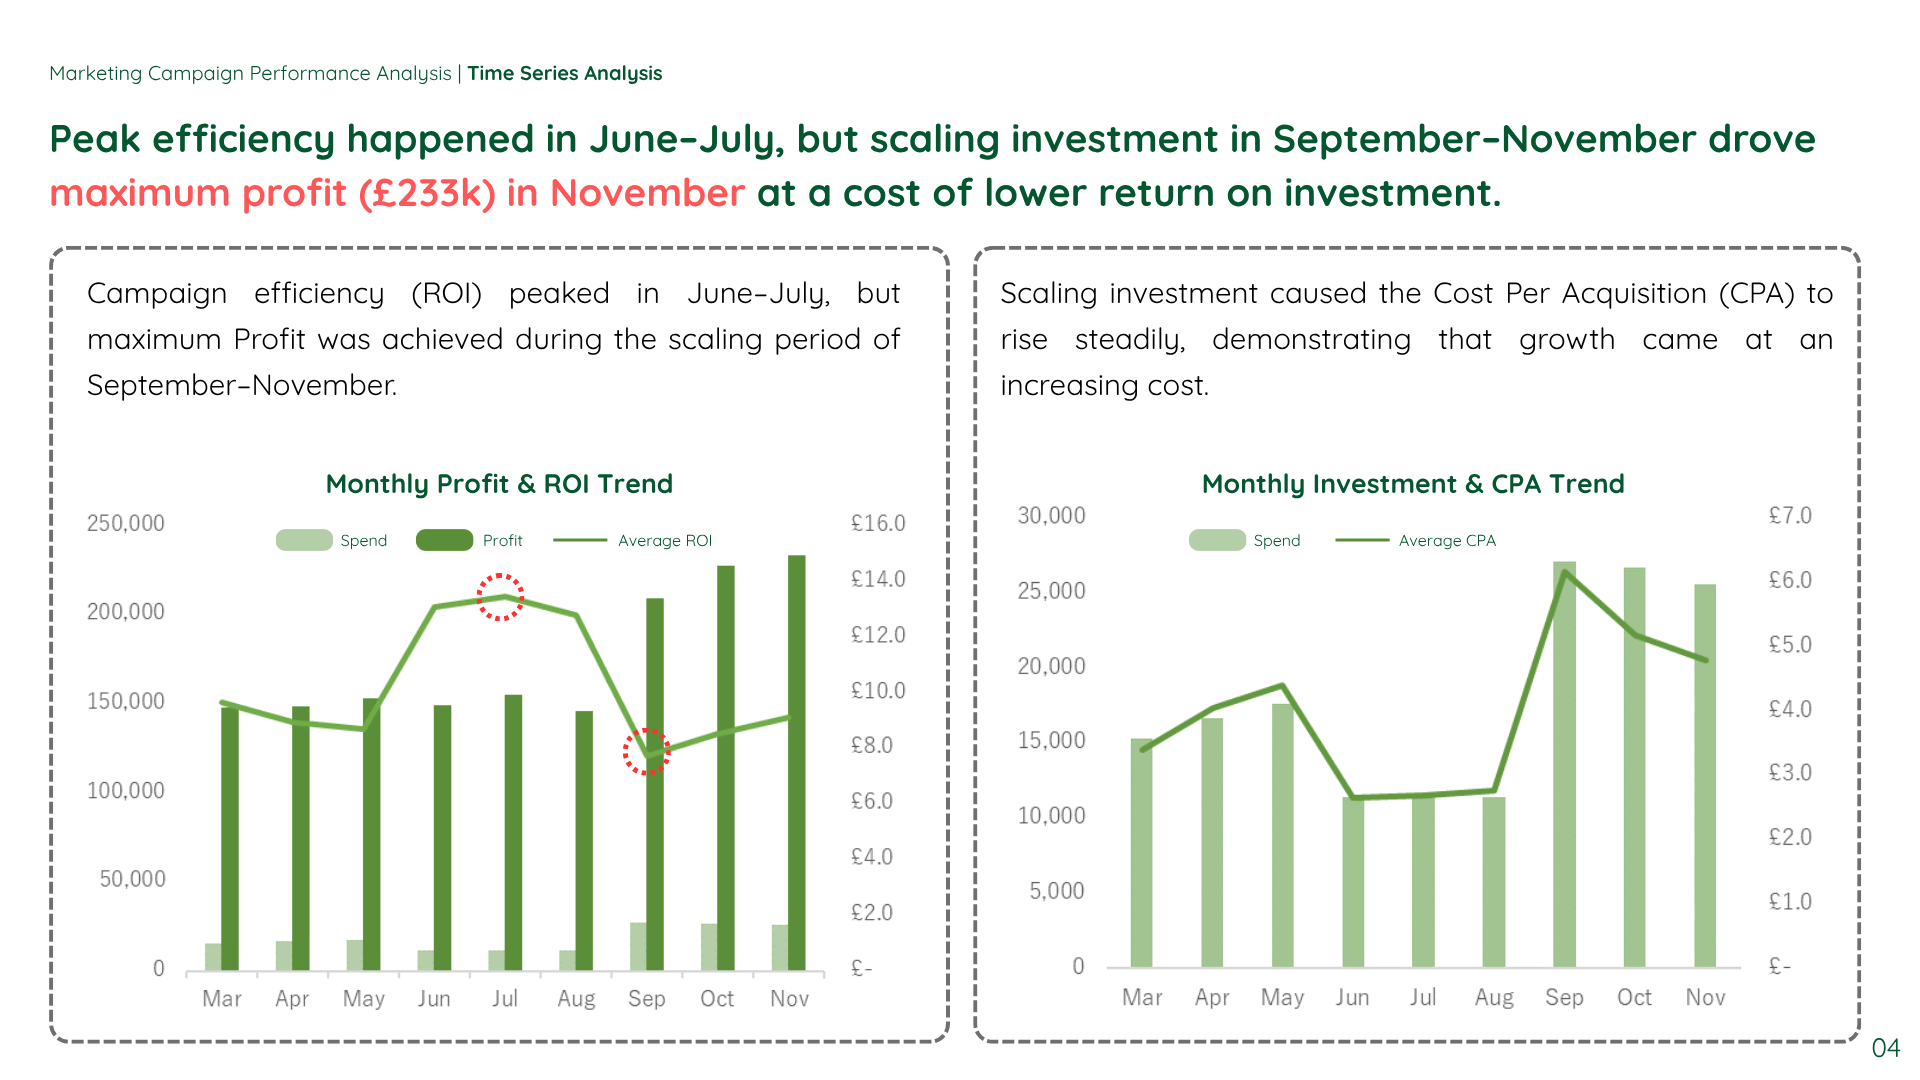
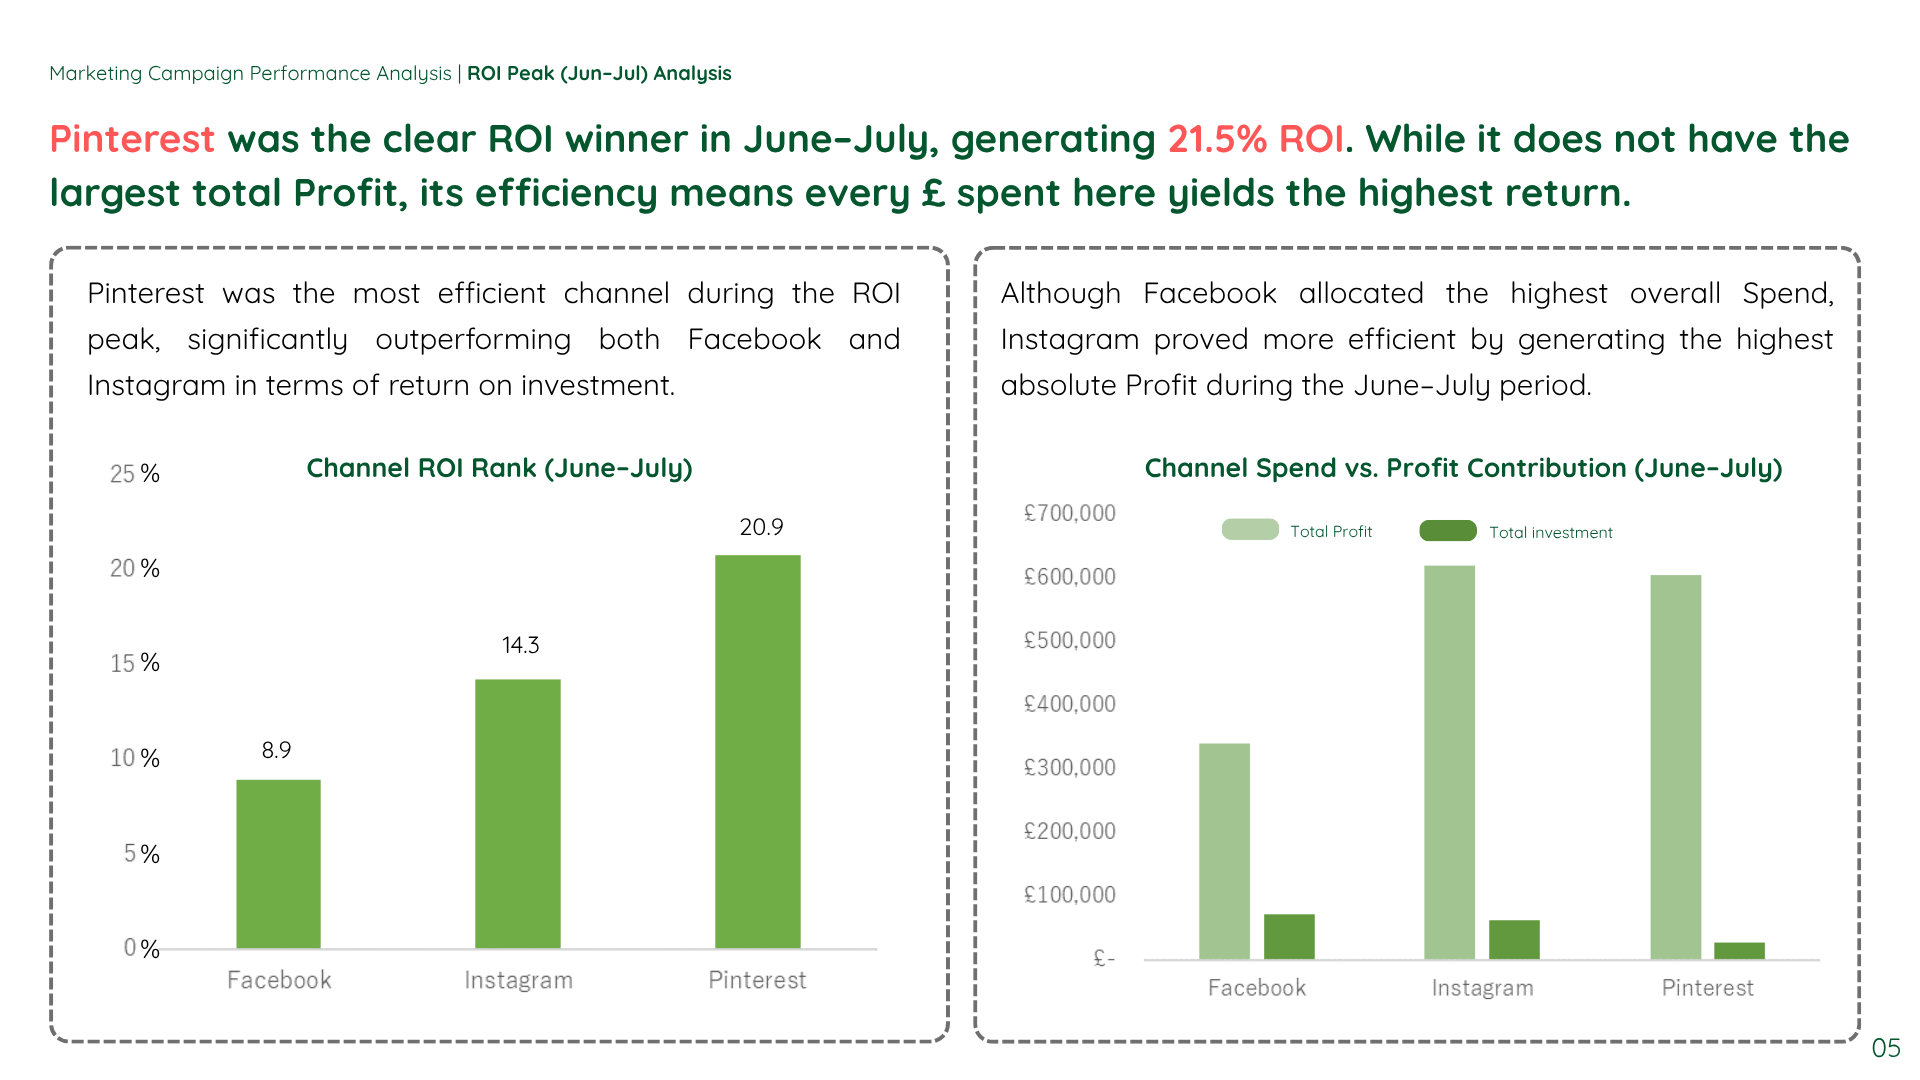
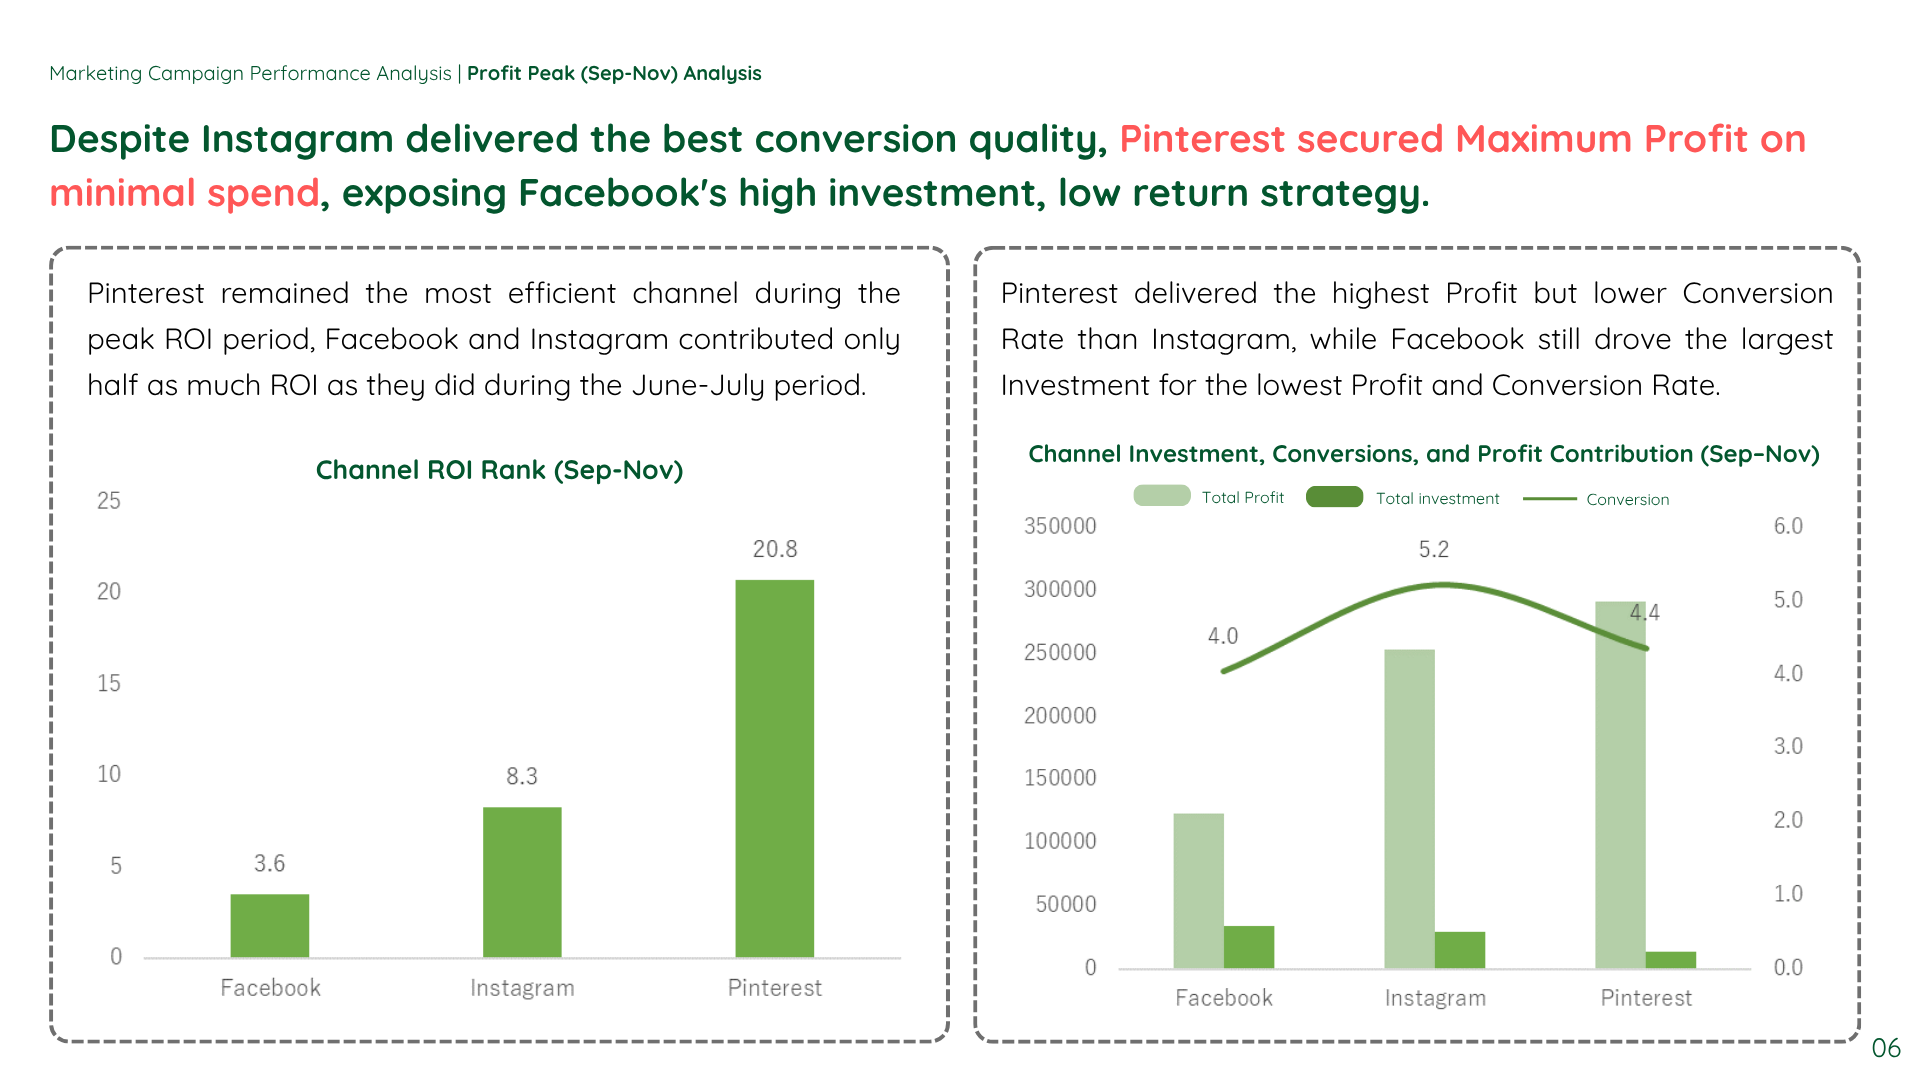
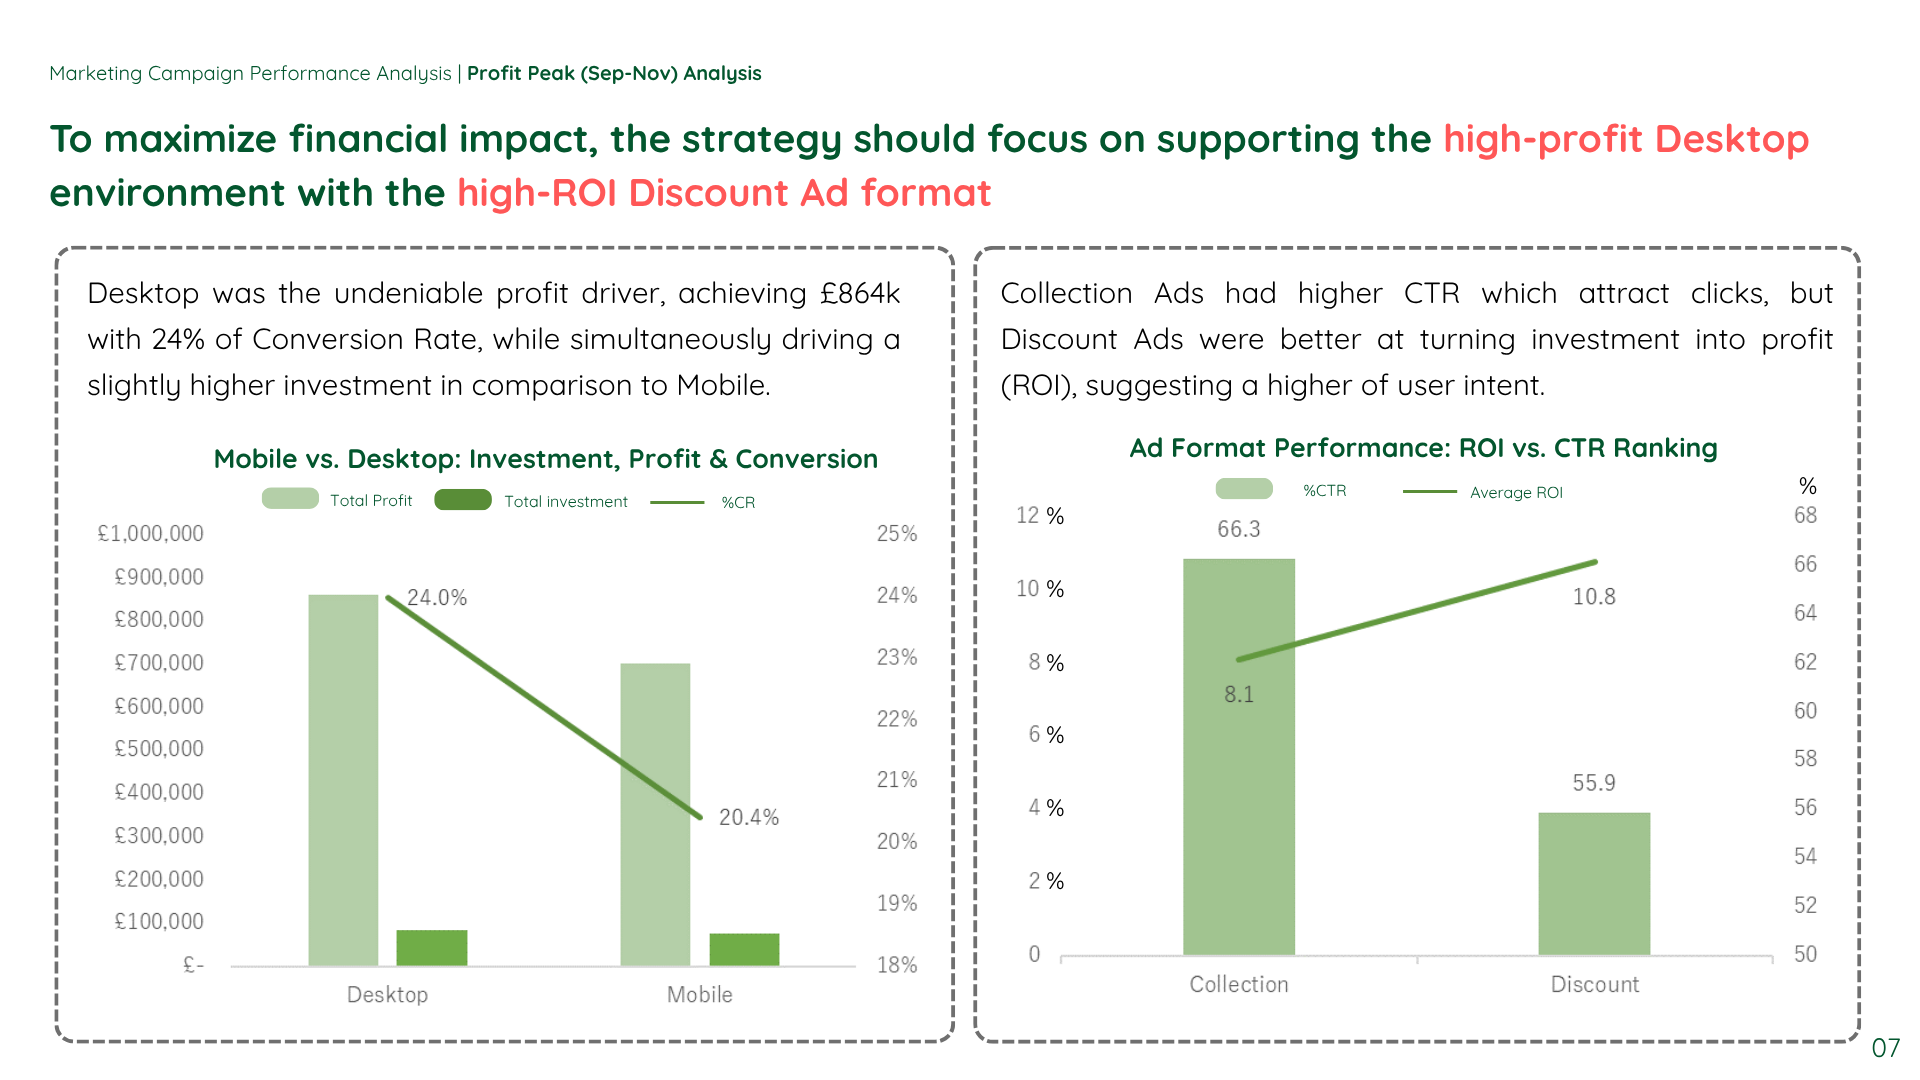
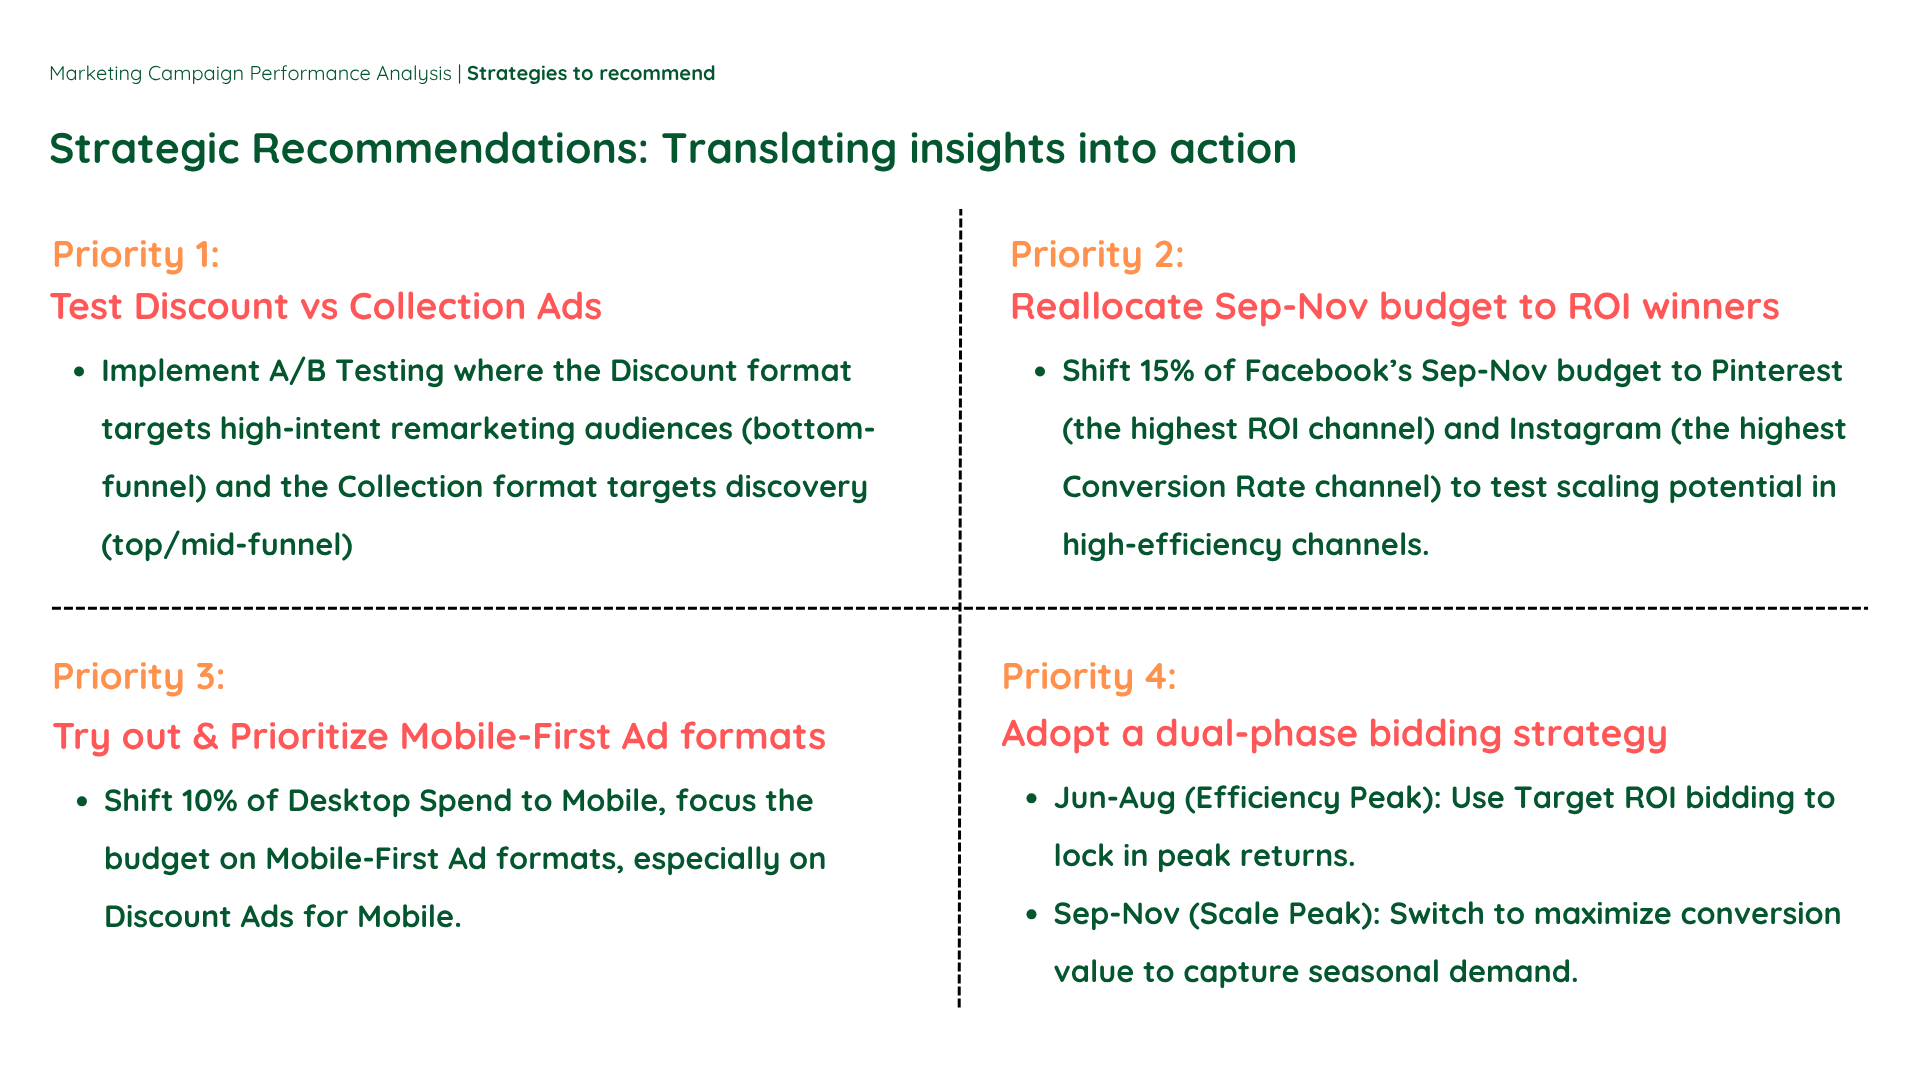
The Marketing Campaign Analytics dataset contains 9,900 records of digital ads run across Facebook, Instagram, and Pinterest in the UK. It includes campaign attributes, devices, geo locations, ad formats, and performance metrics such as impressions, clicks, CTR, conversions, spend, CPC, ROI, and profit. Learners can analyze channel efficiency, device behavior, geo-level performance, seasonal trends, engagement impact, and budget effectiveness. The dataset supports identifying ROI drivers, diagnosing diminishing returns, and generating insights to optimize marketing strategy and allocation.